Perspectives
We just returned home from an epic road trip across Montana—we started in Glacier National Park in the north and worked our way to Yellowstone in the south. The trip was a feast for the eyes—and many times, it was hard to take it all in. The perspectives were so grand that it was hard to determine scale and size…
We saw clouds that mixed with the mountains.


We saw lakes that were like glass.


We saw raging waterfalls, rocks the size of mountains, plains that stretched for miles, deep canyons, glacier fed lakes…


So many of these pictures required a huge step backwards—it was hard to get the full perspective without a wider view…and same with the stock market…
(had to tie in something educational at some point… 😊)
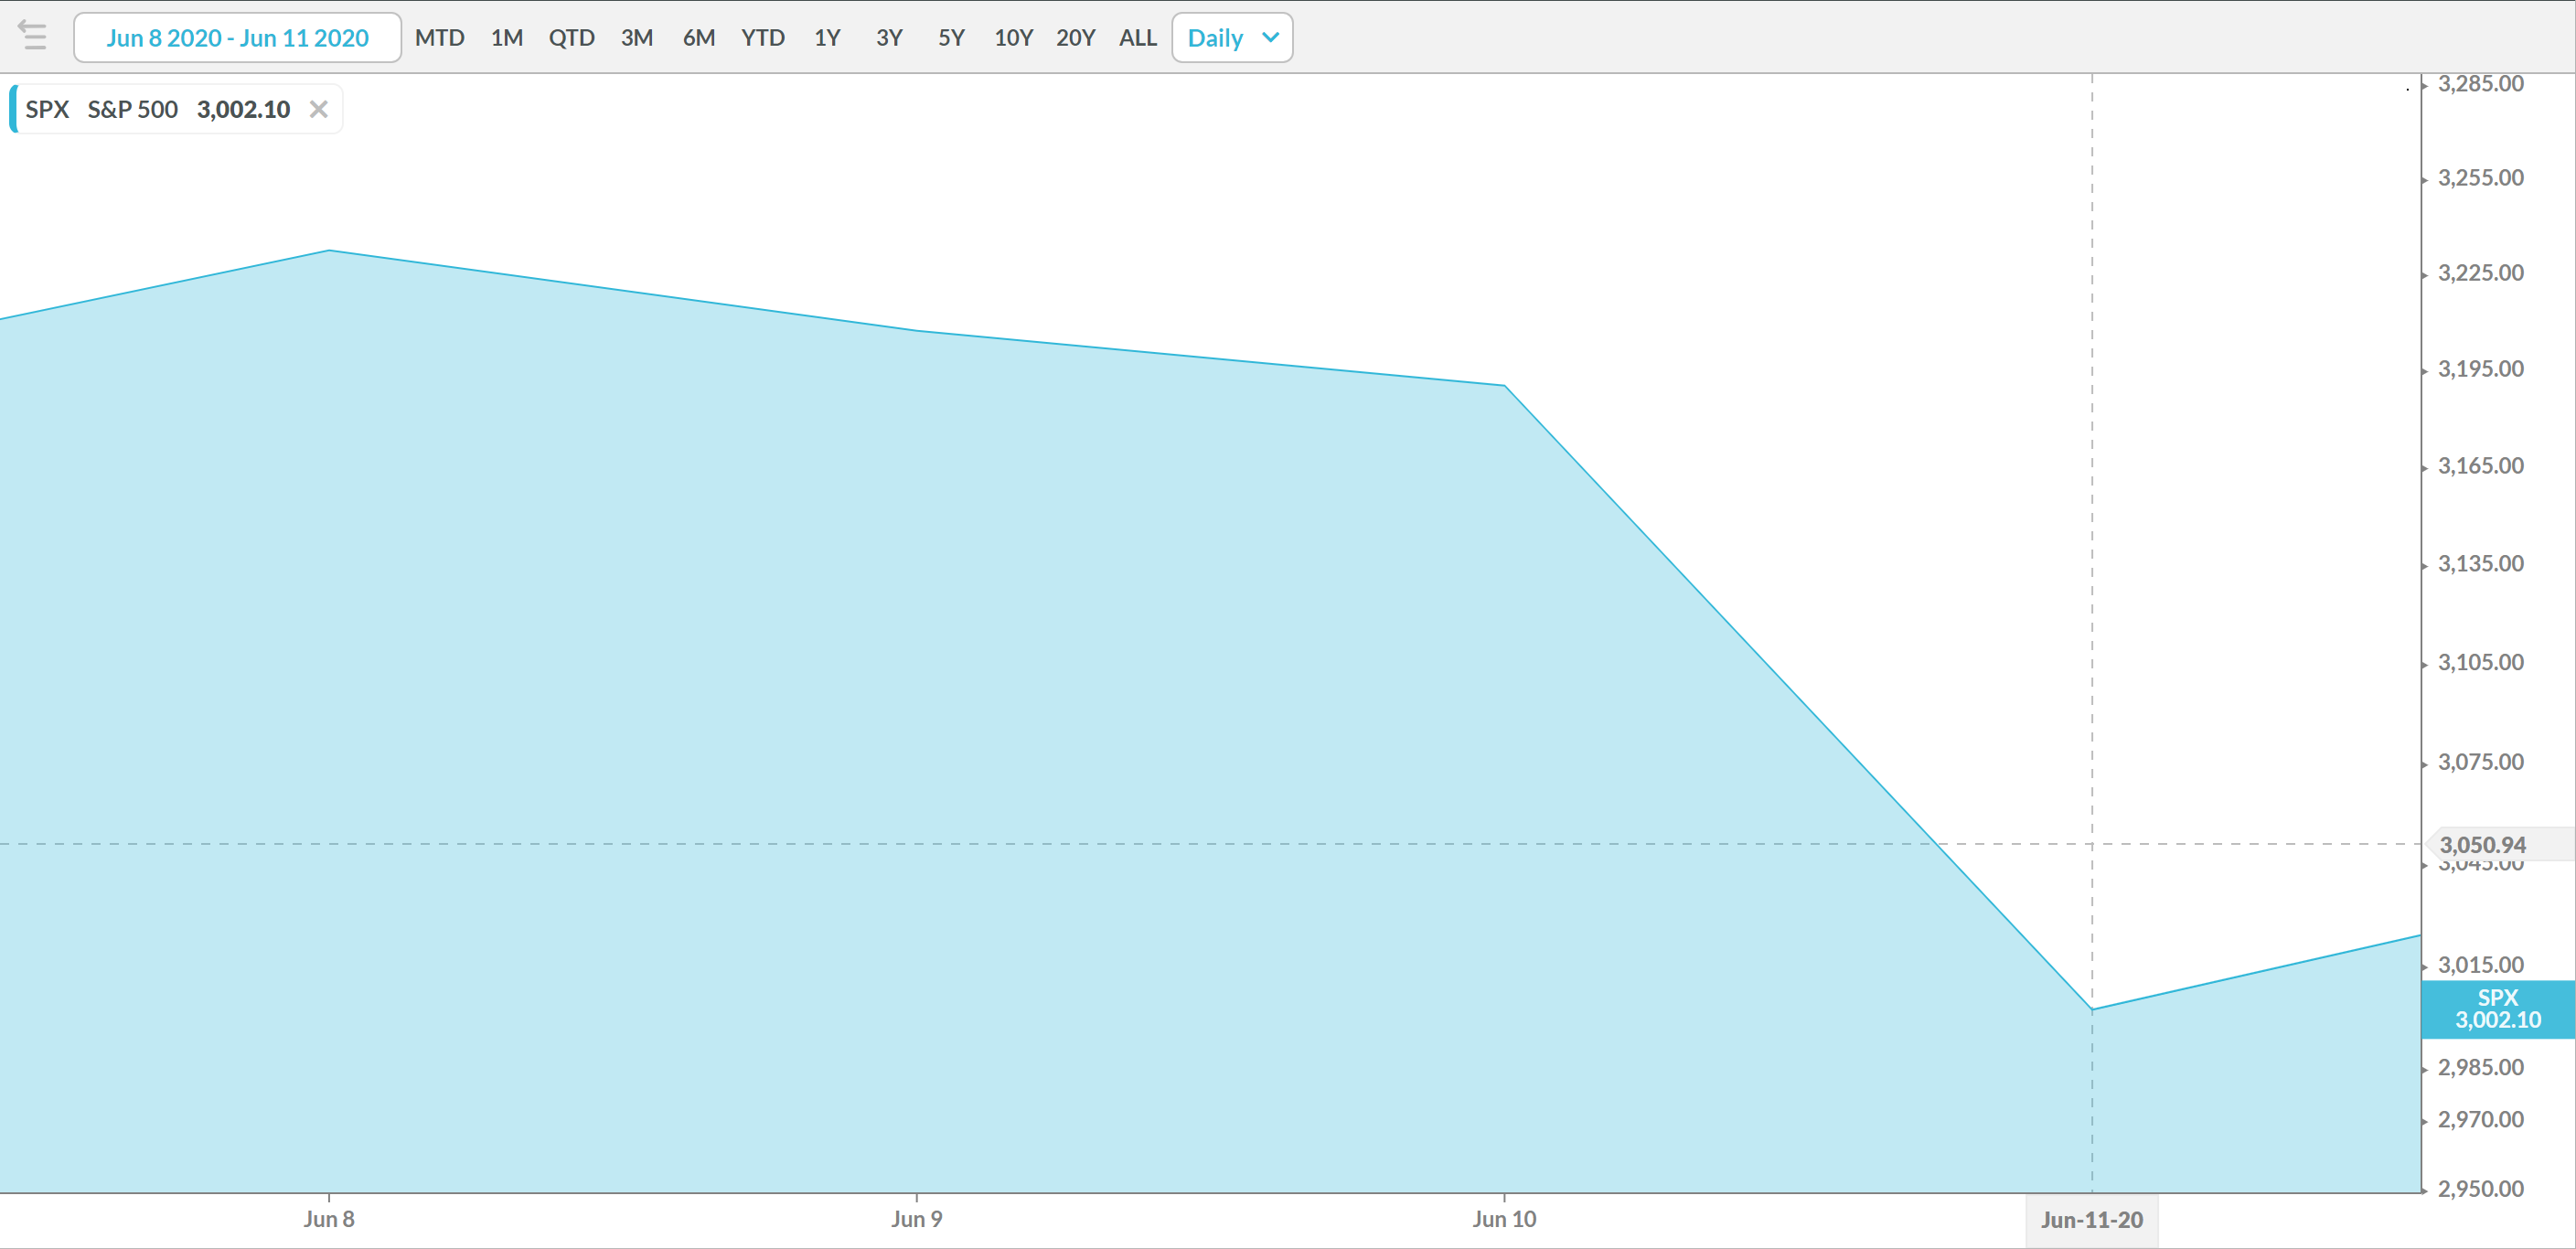
Right before we left on our trip, the stock market had a pretty horrible day. This was the headline:

This news caused stock markets to sell off violently, with the S&P 500 dropping over 6% in two trading sessions:
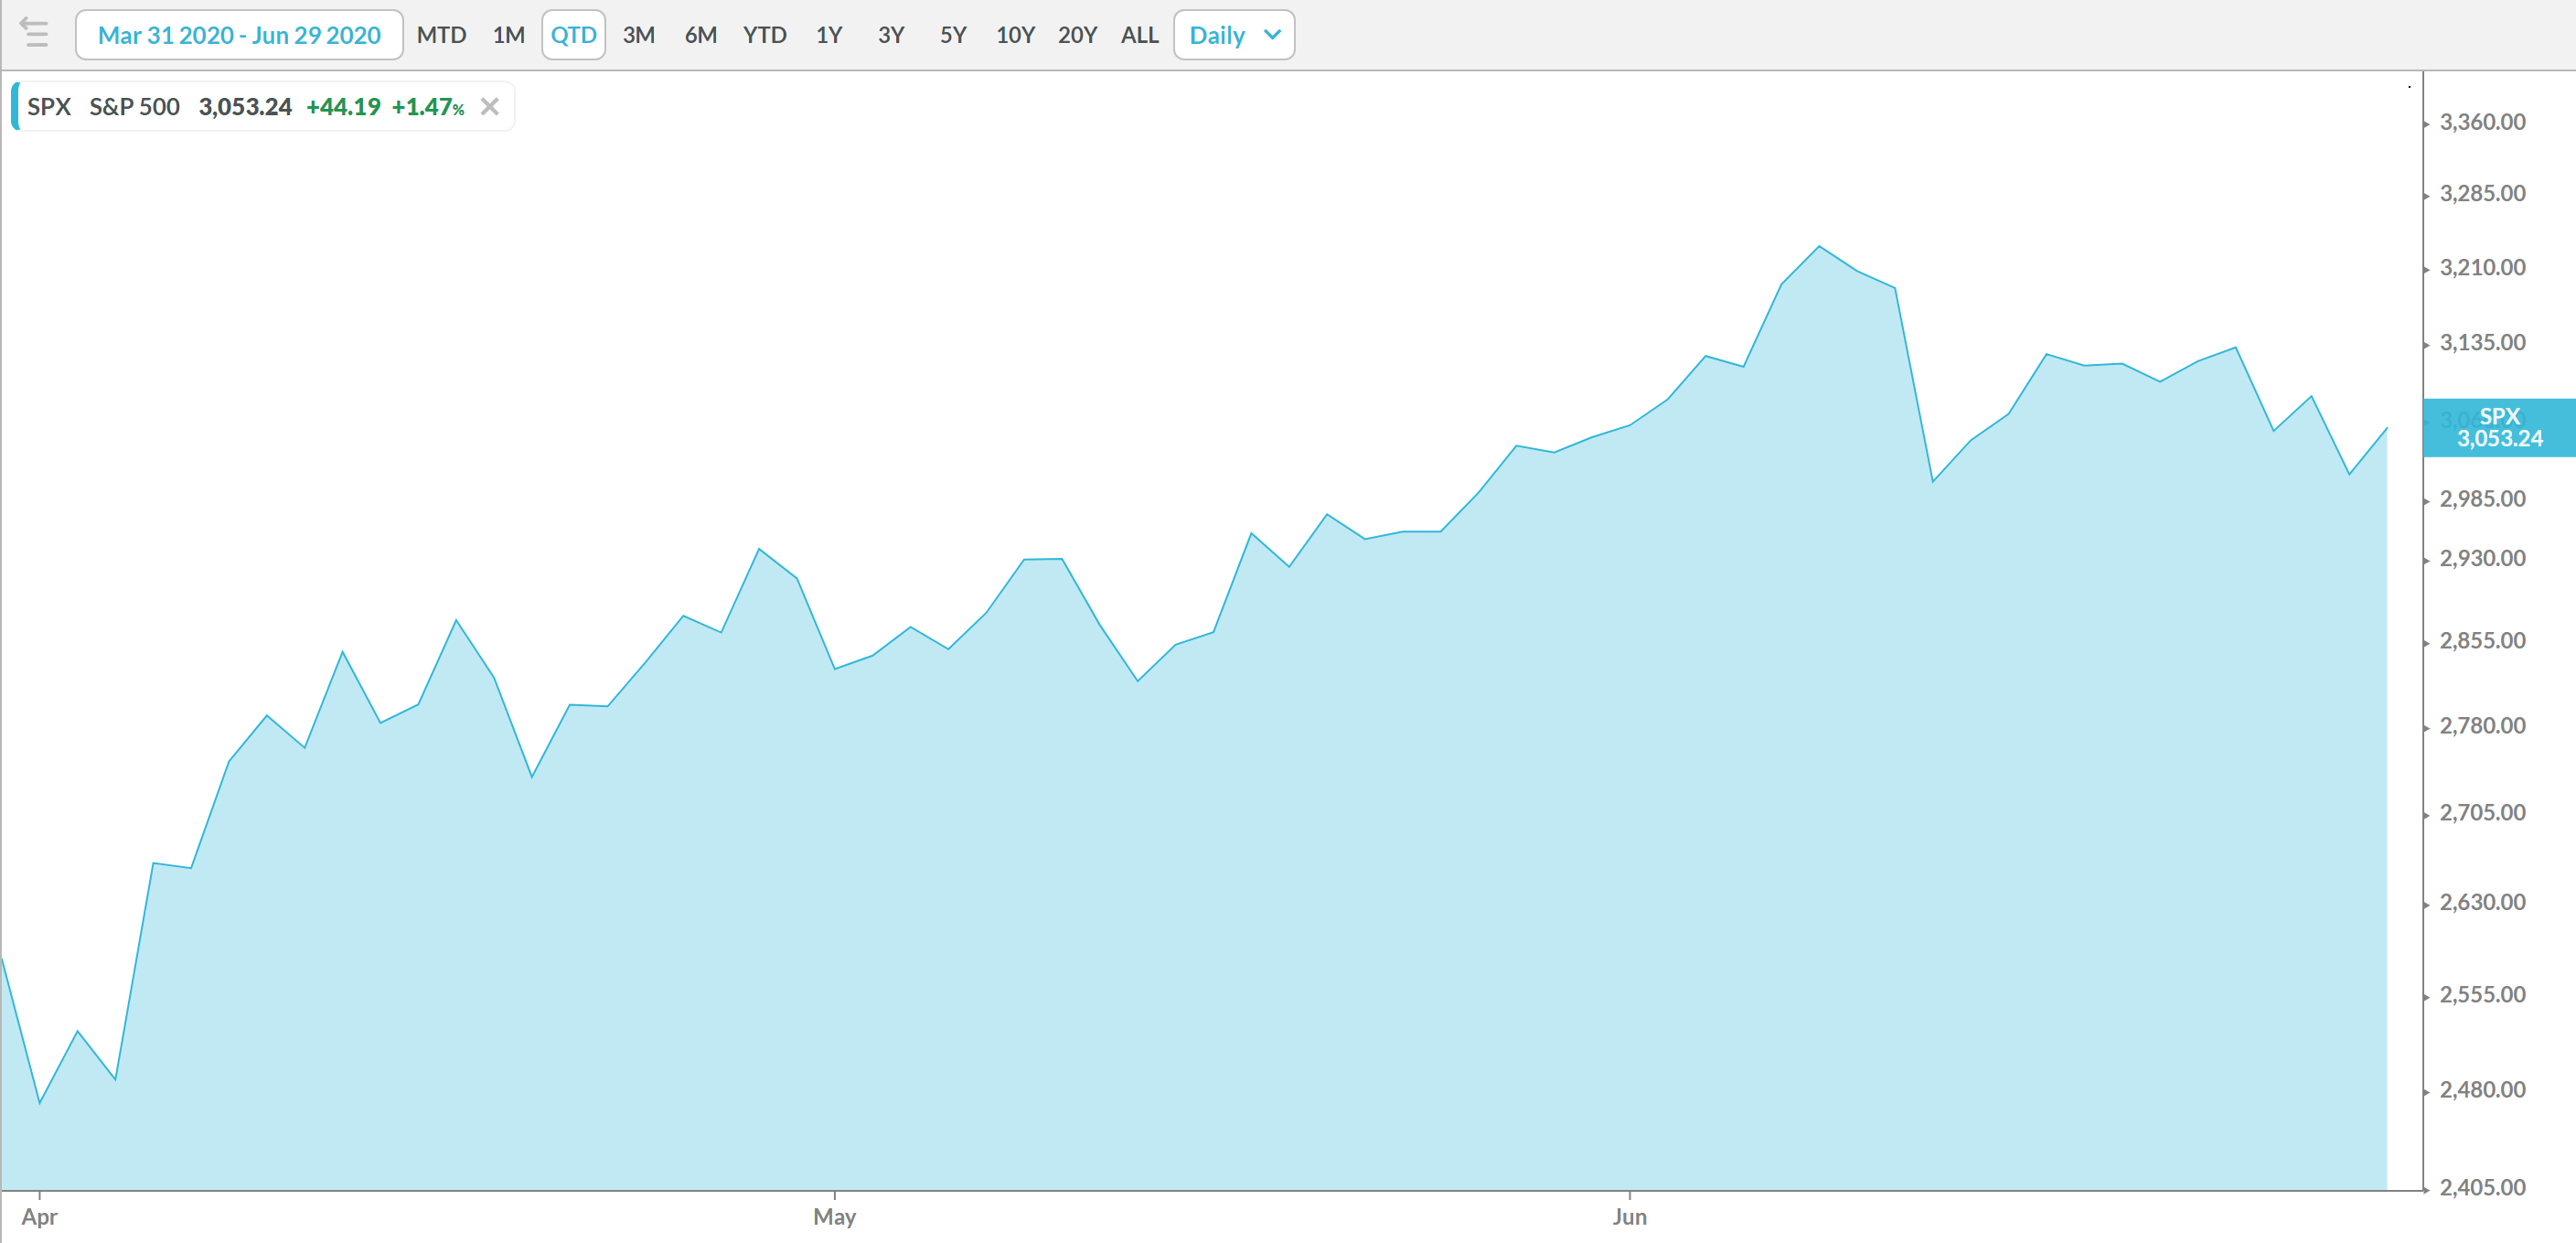
While this drop was jarring after a welcome relief rally, with a step back, the drop doesn’t look so bad over the past quarter. In fact, that daily 6% loss only gave back a small percentage of the gains for the quarter—the S&P 500 is still up over 18% in the 2nd quarter of 2020:
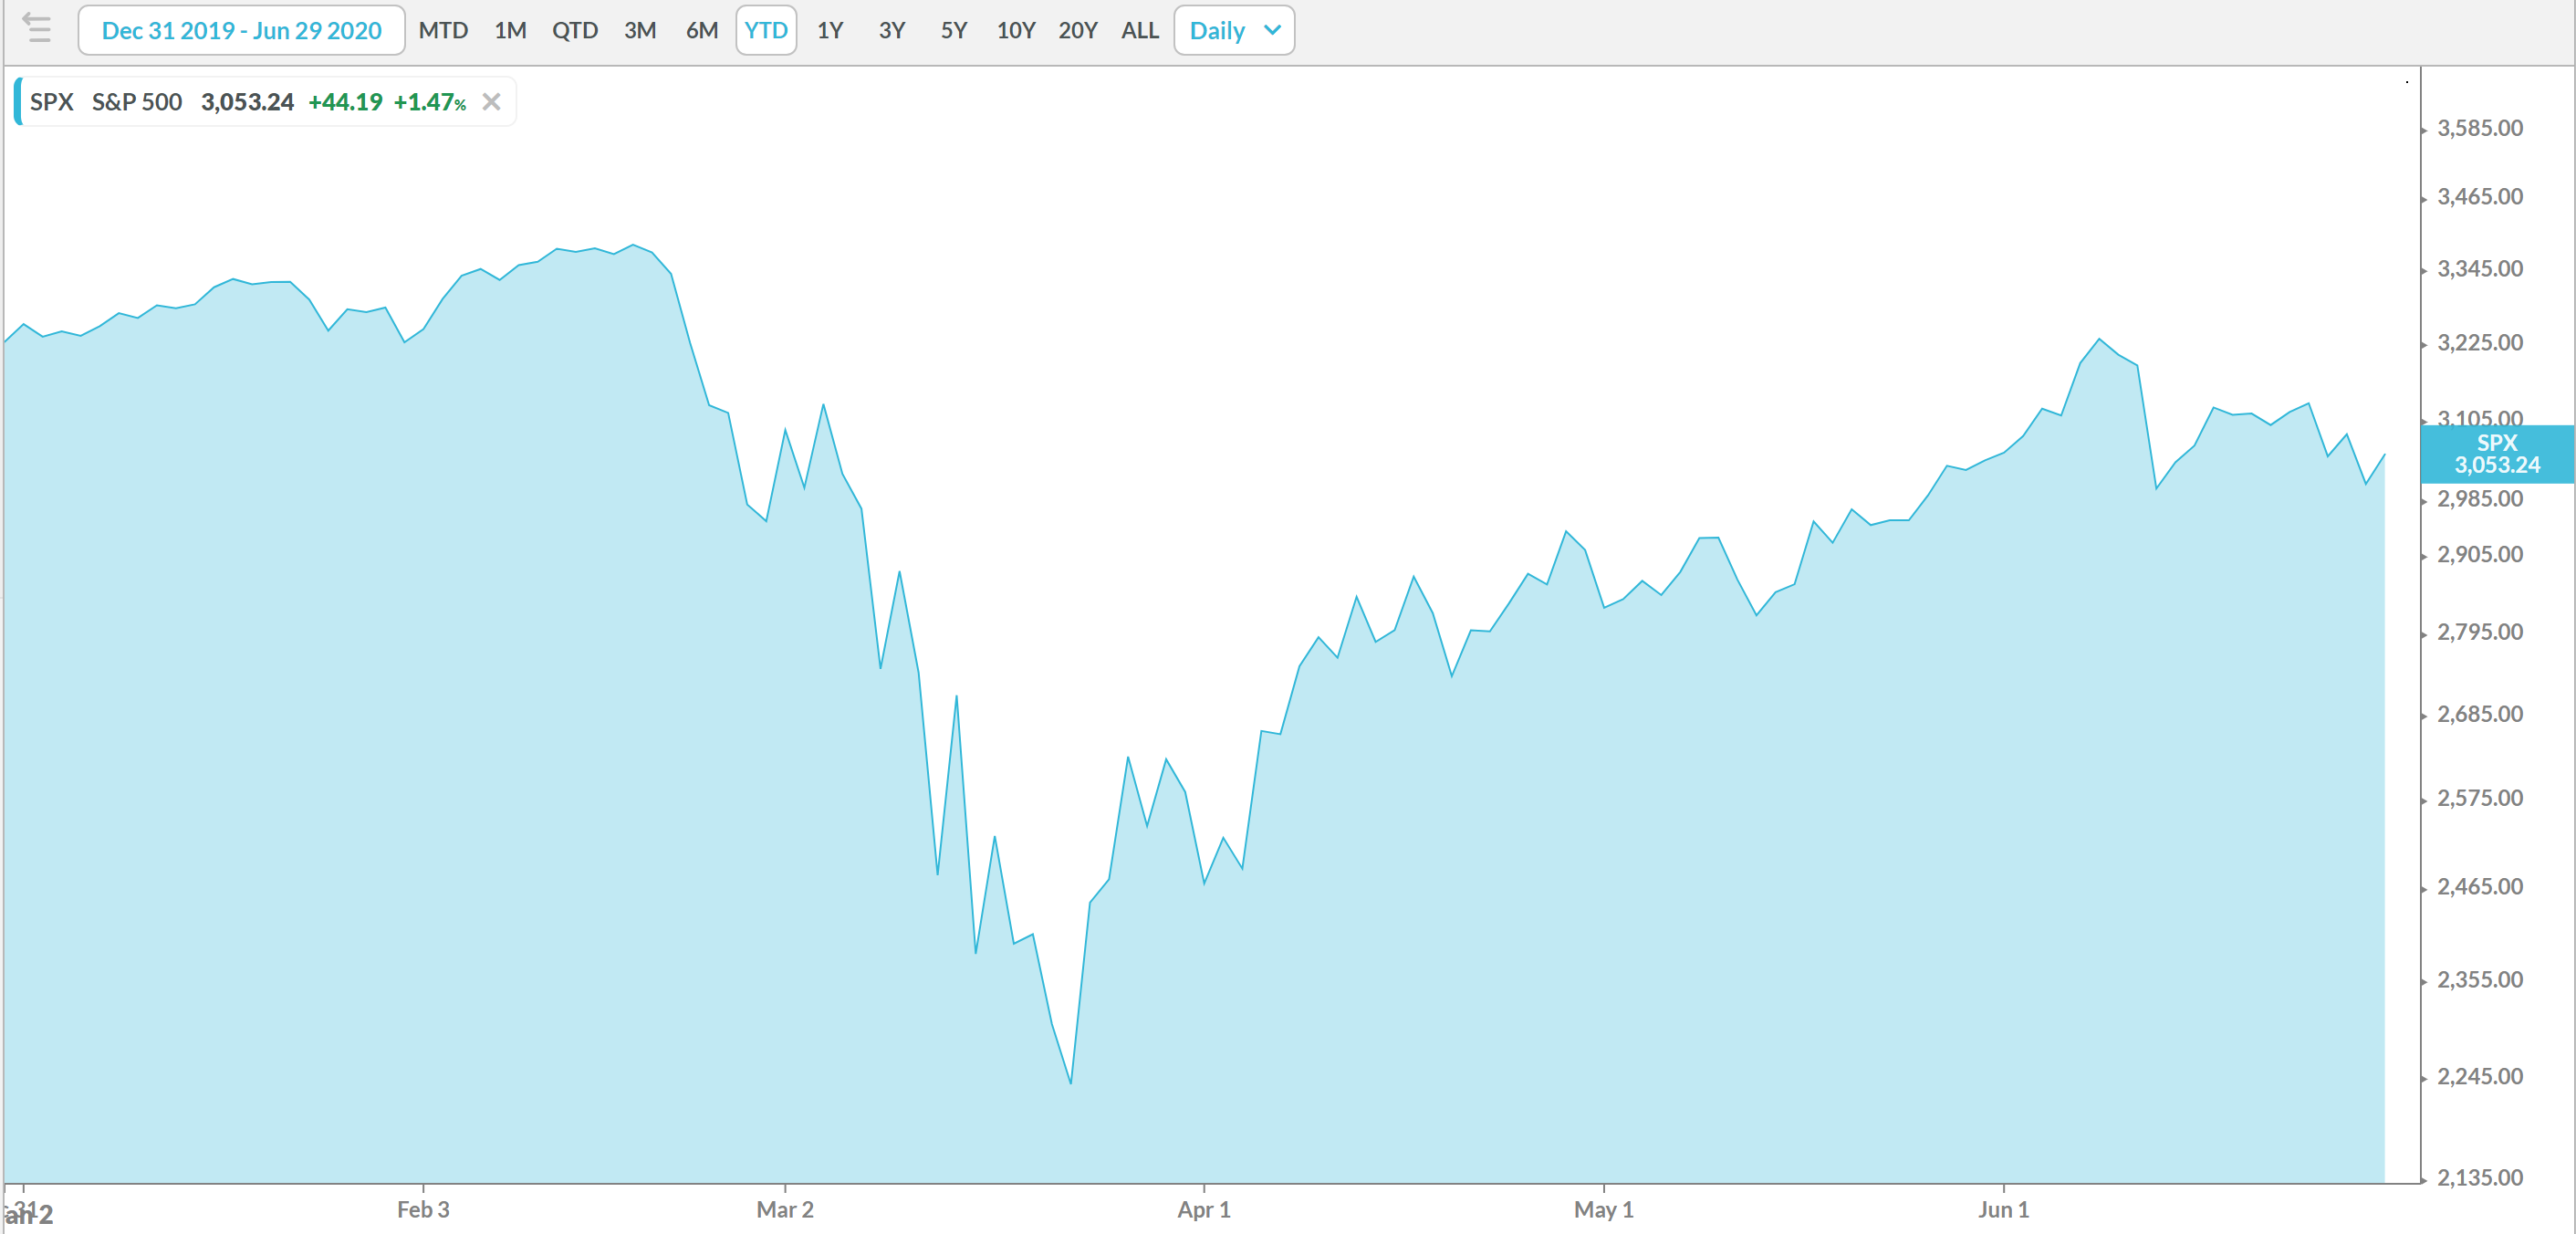
A bigger step back (to a year to date view), and the June 10-11 drop is even less significant with the perspective of the huge drop in March:
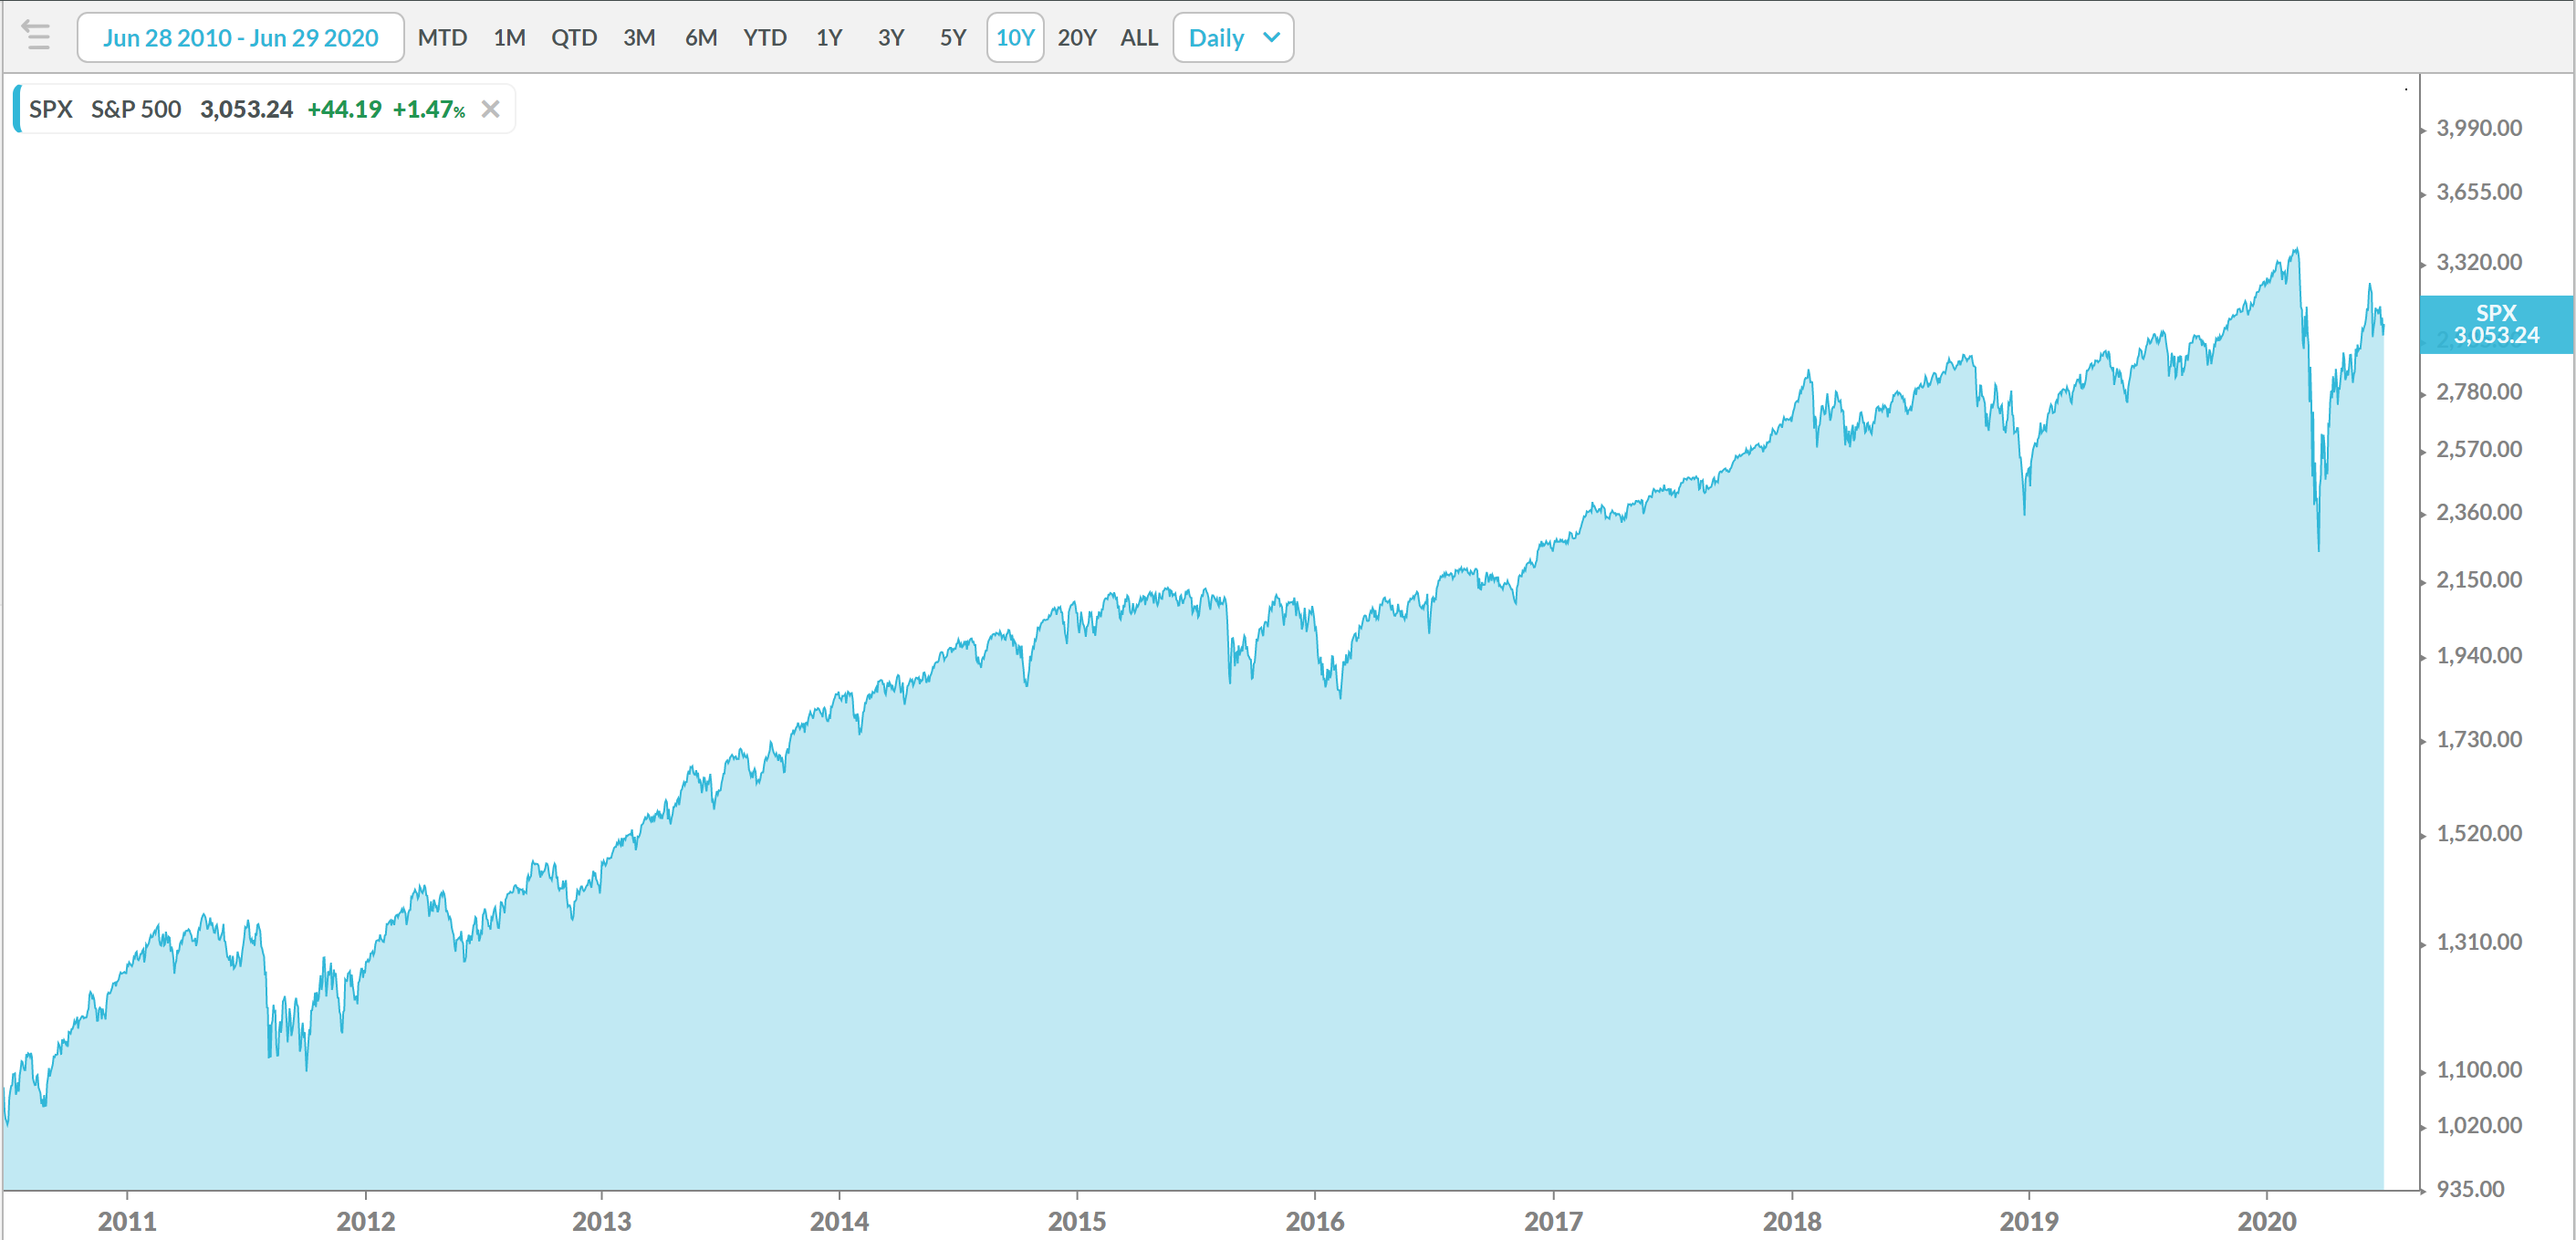
And an even longer lens—a truly big picture view of 10 years—and the June 2020 decline is barely seen:
With a broader perspective, you can truly see the whole picture—not just in nature photographs, but in the market. Daily fluctuations in the market are what our eyes are drawn to, and what cause us to react. But, when taking a step back, we see that over an 80 year time frame:
- The market had positive returns 57% of one year periods since 1929
- The market had positive returns 71% over all rolling five year periods since 1929
- The market had positive returns 86% over all rolling ten year periods since 1929
- The market had positive returns 97% over all rolling twenty year periods since 1929
US stock market annualized returns, 1929-2019
1-, 5-, 10-, and 20-year rolling periods
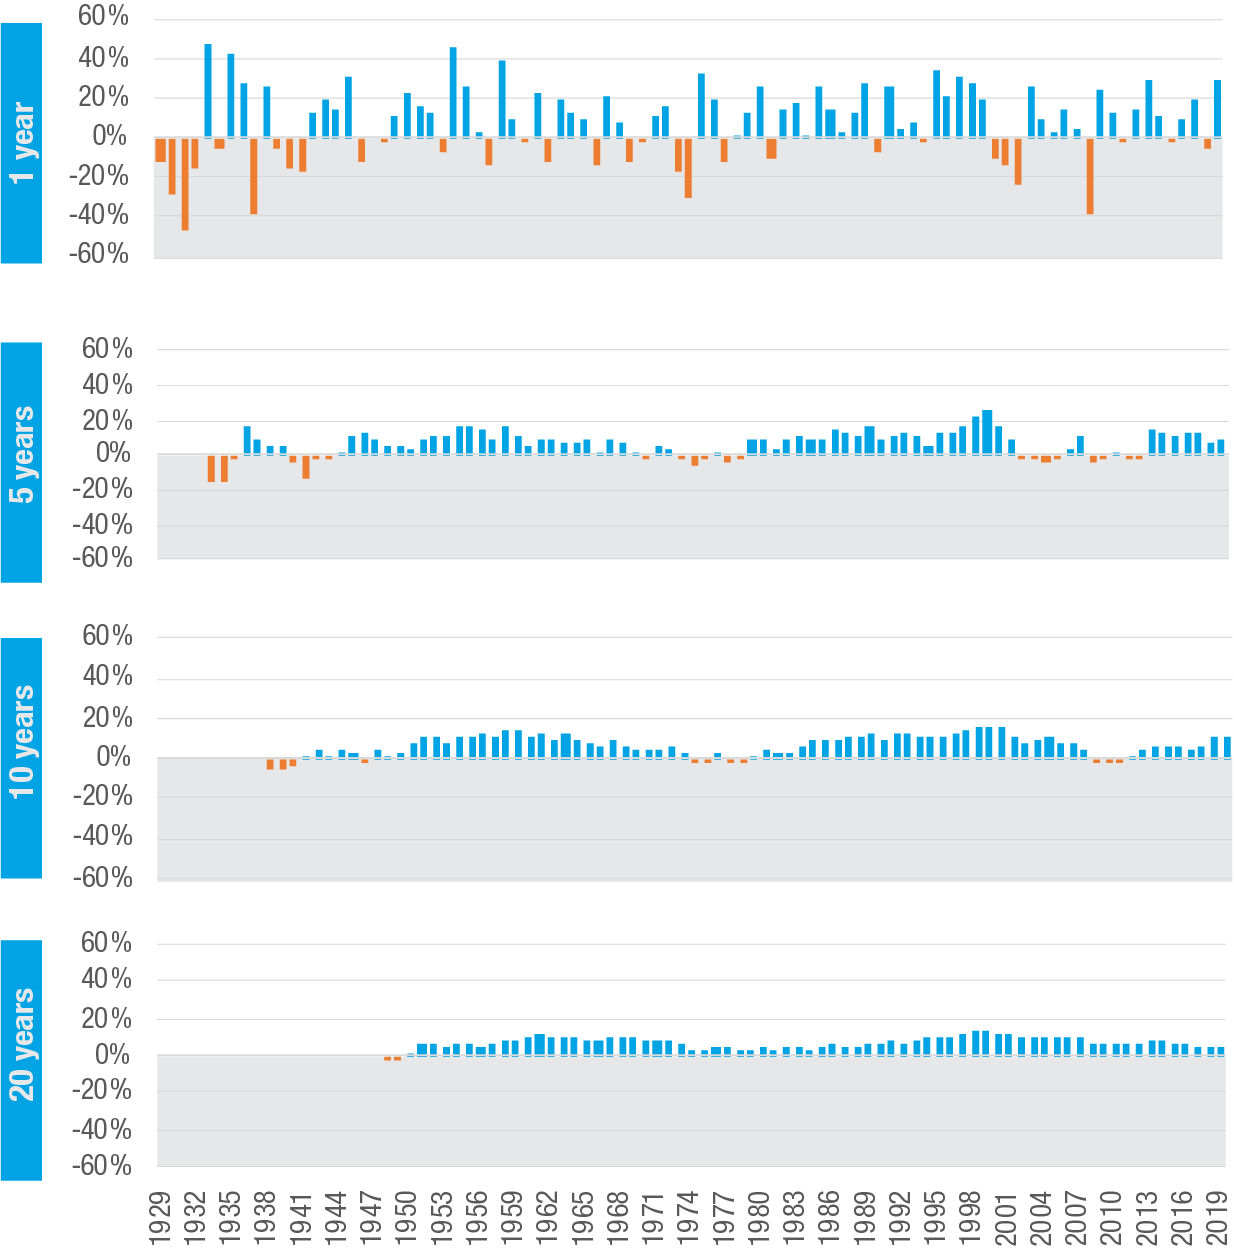
Data are adjusted for inflation and assume reinvestment of dividends.
Past performance does not guarantee future results. Charts shown throughout are for illustrative purposes only and not meant to predict actual results. Chart is for illustrative purposes and not representative of the performance of any specific investment.
Pretty crazy what you see with a little perspective! 😊