Sell in May and Go Away
Like all catchy adages, the annual stock market advice to “Sell in May and Go Away” does have a kernel of truth to it. A 2015 white paper studied the returns of the stock market over various years from May – October versus November – April and found that on average, the November – April period returned almost 10% more than the summer period beginning in May.
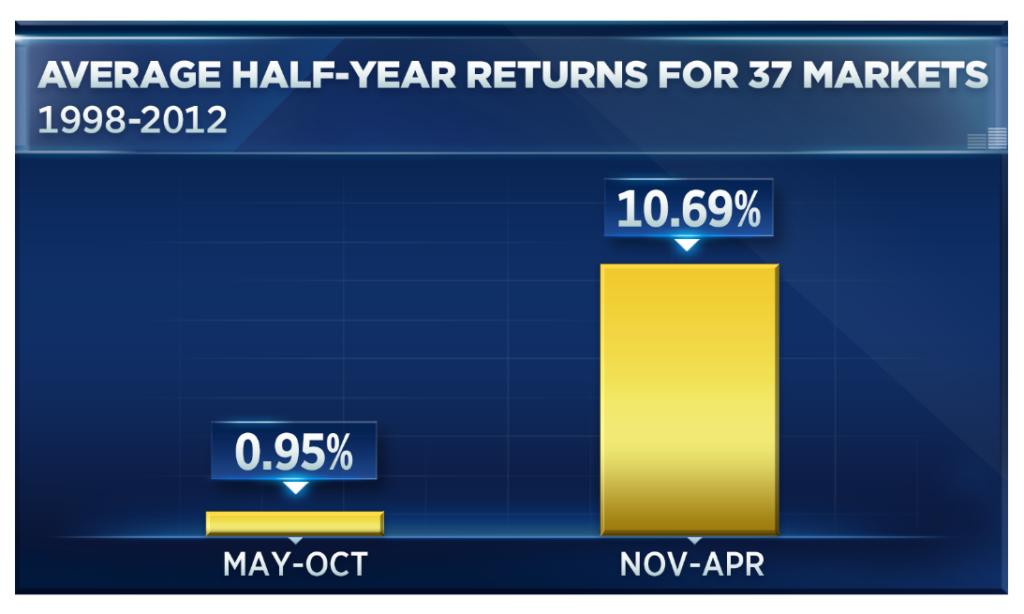
Image courtesy of http://www.cnbc.com/2016/04/29/it-sounds-crazy-but-sell-in-may-and-go-away-is-good-advice.html
So, as is typical, the media has jumped on this story and is projecting the summer market dead:

However, just as “an apple a day keeps the doctor away” is not intended to be the definitive word on full body health, neither is “sell in may and go away” intended to be a definitive portfolio strategy!! Here are several reasons why you should stay invested this summer:
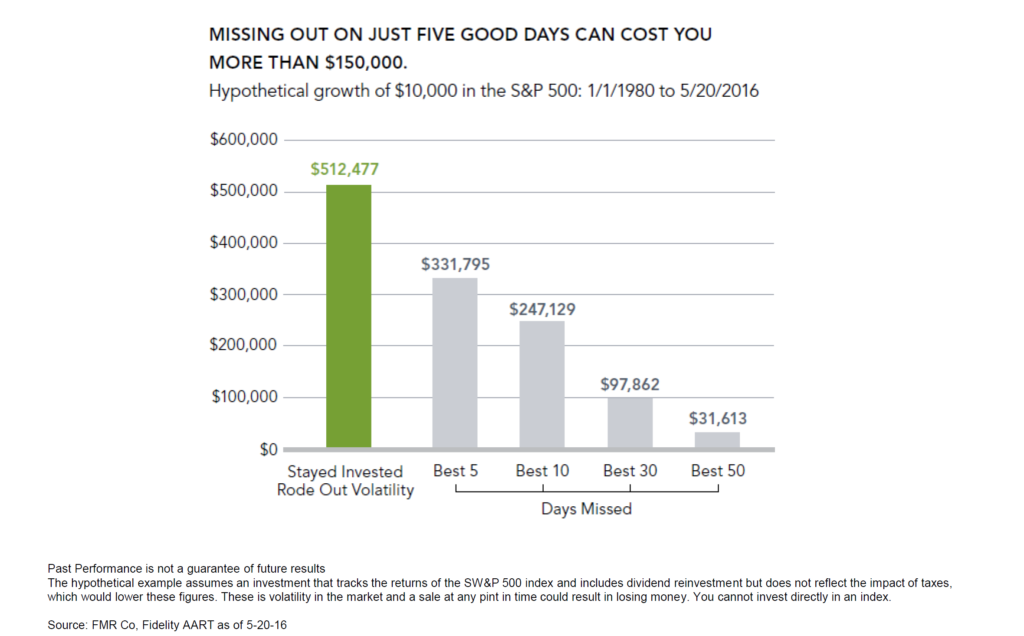
1. Selling in May and getting back in later in the fall means that you have to make two good calls—when to sell and then when to buy back in. Given that missing just the 10 best stock market days in a 36 year period (most of which were clustered around some of the worst days) can cause you to miss out on almost half of the total gain in the stock market, timing the market is a losing proposition.
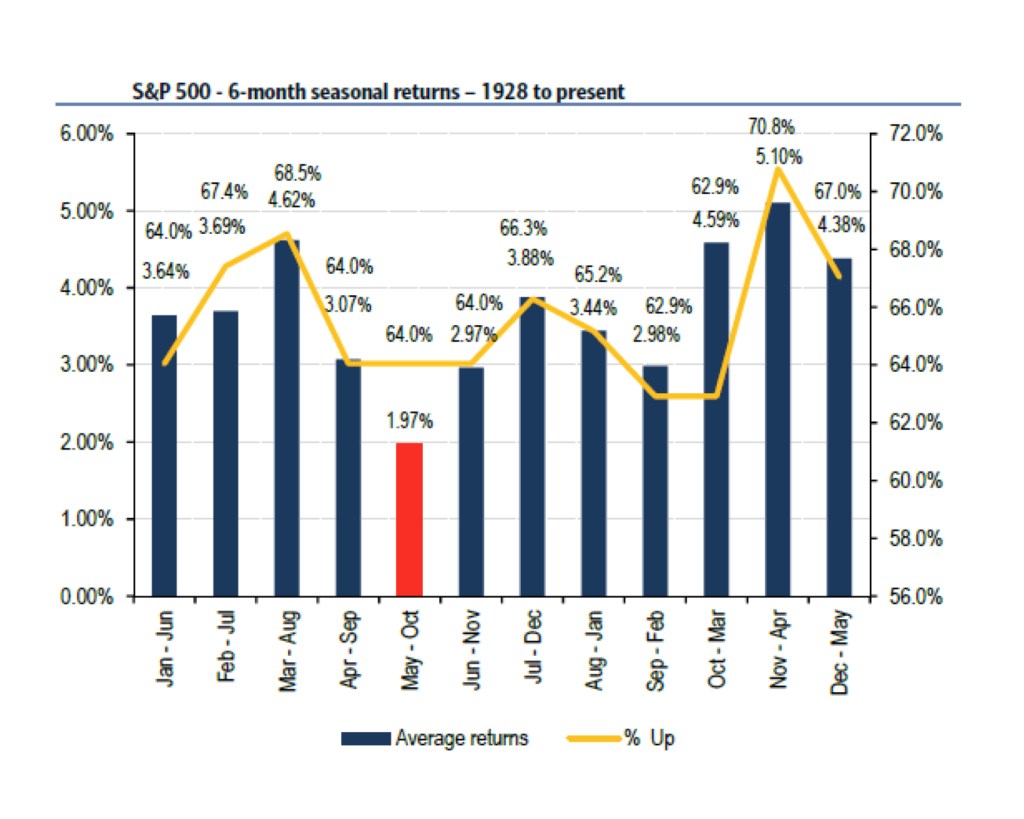
2. Even though the returns have typically been lower during May – October, the average return during that period is still positive! Since 1928, the average return from May – October has been 1.97%. Given that cash alternatives are paying practically 0%, 1.97% doesn’t seem like a bad deal for letting your portfolio stay invested while you are playing at the beach!
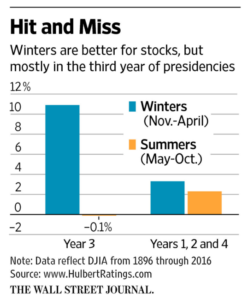
3. A recent Wall Street Journal article noted that the “sell in May” performance discrepancy is almost all explained by the summer returns during the third year of a presidential term. In years 1,2, and 4, both the winter and summer period returns tend to be positive. The summer return in year 3 is what sinks the long term average…
So, while we know for certain that “honey catches more flies than vinegar”, the old adage of “sell in May and go away” is far less predictable!! Perhaps a better adage for the summer is:

Ben Yakel enjoying a solitary walk on the beach…
