A Shocking Surprise
This weekend, my family and I took a little trip to Lake Anna. We stayed in a lovely house right on the water, and kayaks were provided. As the weather was a cloudy and cold 40 degrees, I had no desire to get our in a kayak on the lake, but not to be dissuaded, my little boys had to give it a try. We placed bets on how soon it would take our accident prone littlest one to fall in. Ben made it past the over/under of 30 minutes, but just aby a hair. Right before we called them back for dinner, Ben got excited and forgot not to wiggle and fell right in the lake.

(Ben still afloat before his tumble)
We were in a little inlet, so the water was only about two feet deep, so Ben was fine, but we wish we had captured the shocked look on his face as he popped up—the water was SO cold!
As the first quarter of 2018 draws to a close, we feel that first quarter statements may be a shocking cold douse of water for bond investors. For the first time since 2013, boring and staid fixed income investments—bonds—are down over 2% year to date.
This price decline is understandable if you understand the mechanics of how bonds work.
This is an old old US Treasury Bearer Bond. There are two components to this bond:
- The face value, which was the initial issue price of the bond (because the bond generally always had a face on it)
- The coupon—one for each interest payment of the bond
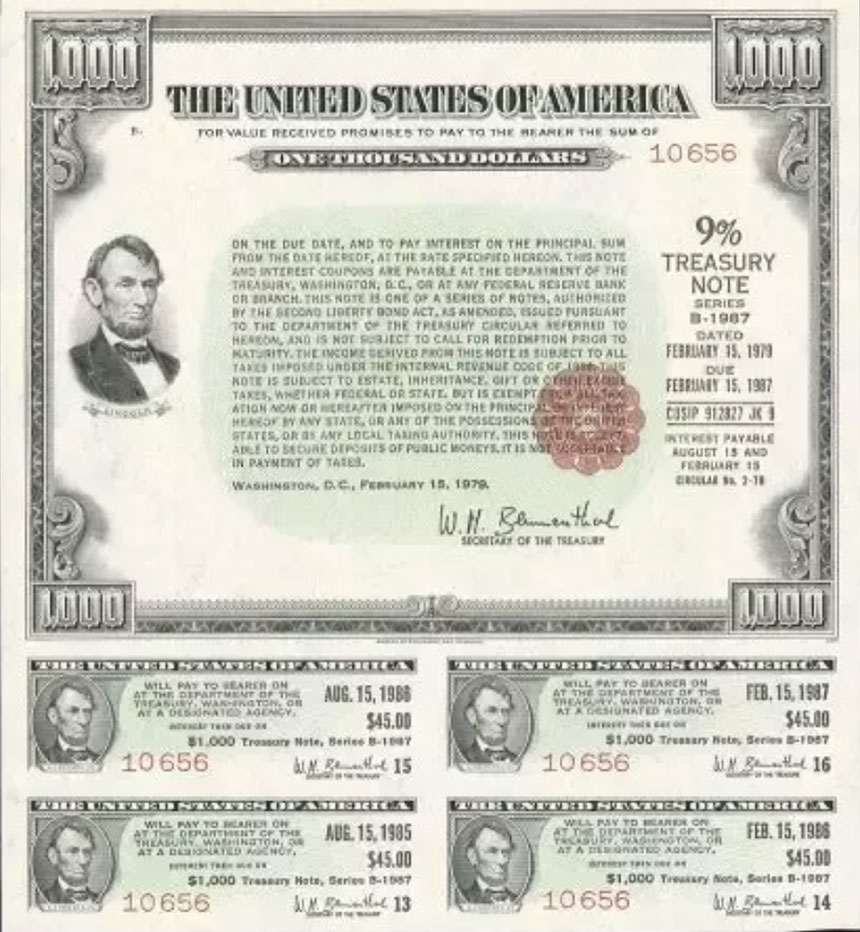
So, in the case of this bond, you would loan the US Government $1,000 from February 1979 until February 1987…at which time the government would repay your $1,000 face value. From 1979 until 1987, this bond would pay $45 of interest every six months (9% annually). The bearer of this bond would clip off each interest coupon and take it to the bank to be receive their interest payment.
It is these two features—the total face value and all of the interest payments that provide the base value of a bond.
For example, if you purchased a one year $10 bond that pays 2% interest, the total value of the bond is:
$10 face value + $2 interest payment = $12 total value
Now, if interest rates rise, and new one year bonds are issued at 3% interest, the value of these bonds are:
$10 face + $3 interest = $13 total value
So, if you are holding the old bonds paying 2%, guess what? No one wants to buy your old 2% bond anymore when brand new shiny ones pay 3%. So if you want to sell your old fashioned 2% bond, the only option you have is to put it on sale. If you discount the price of your bond by $1, then your bond will pay the same as the new ones:
An investor would pay $9 for your $10 bond, so that at maturity, they would get $10 face + $2 interest. Adding the $1 gain on the face value of the bond, plus the $2 interest makes the bond worth $13 to an investor…the same value that a brand new bond would be.
And it is this math that makes bonds challenging this year, as when interest rates rise, the prices of all existing bonds will drop. And interest rates have started to move up in 2018:
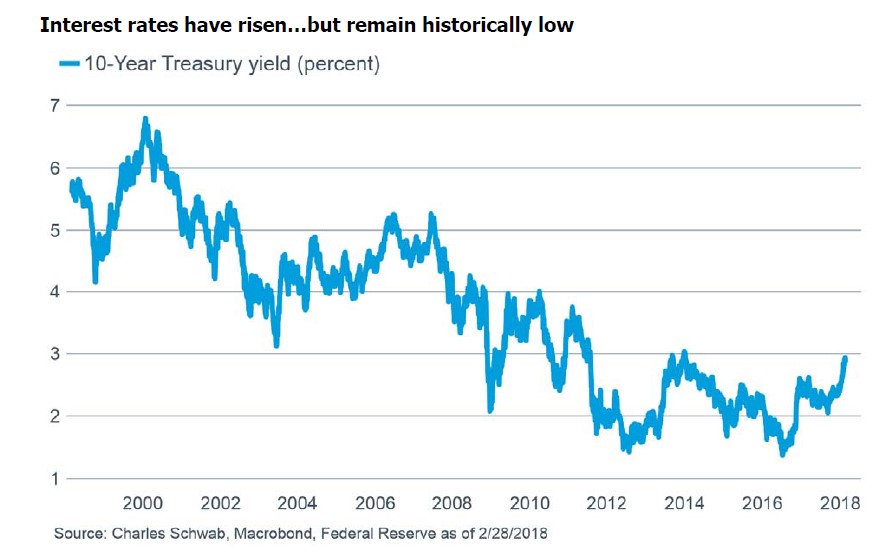
The good news is that bond losses are generally temporary. If you have purchased an individual bond, you simply hold it until the maturity date and then you are paid the face value, despite whatever the bond may have been priced at in the middle of the bond term. Therefore, if you don’t sell, you don’t take the price loss.
In bond mutual funds, losses are also typically short lived as the increased interest rates make up for the initial face value discount.
In a recent blog by Betterment, they looked back on three different periods when interest rates rose. They asked:
“After bonds experience a loss, how long does it take for them to recover? What we found was that losses for bonds have been consistently short-lived. In fact, there was not a single occurrence of back-to-back losses for bonds during the past 30 years.
That is what each of the graphs below demonstrate. Assume you invested $100 on January 1st of the worst year during each interest rate cycle. That is your “Initial Deposit.” After one year, you may have lost money, but in the year immediately following, you made your money back, and then some.
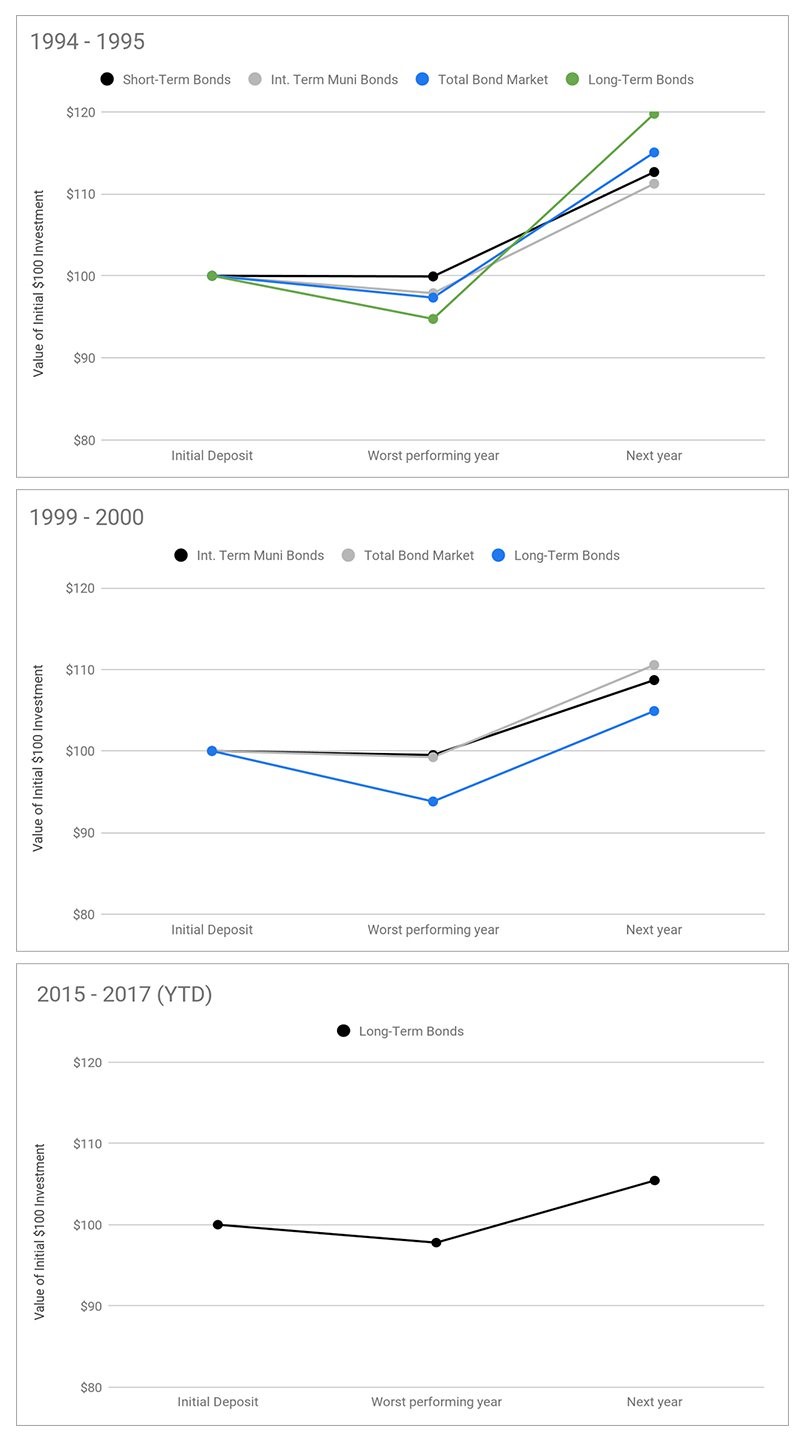
For the graphs above, “Initial Deposit” is a hypothetical deposit of $100 just before the start are of the worst performing year. We describe these graphs in terms of dollars, to more easily communicate how the value falls and increases over time.
As made clear by the charts, the bonds’ respective worst years in each period of interest rate hikes were all subsequently followed by years with positive annual returns. In each case, the losses of one calendar year led to gains the next calendar year.”
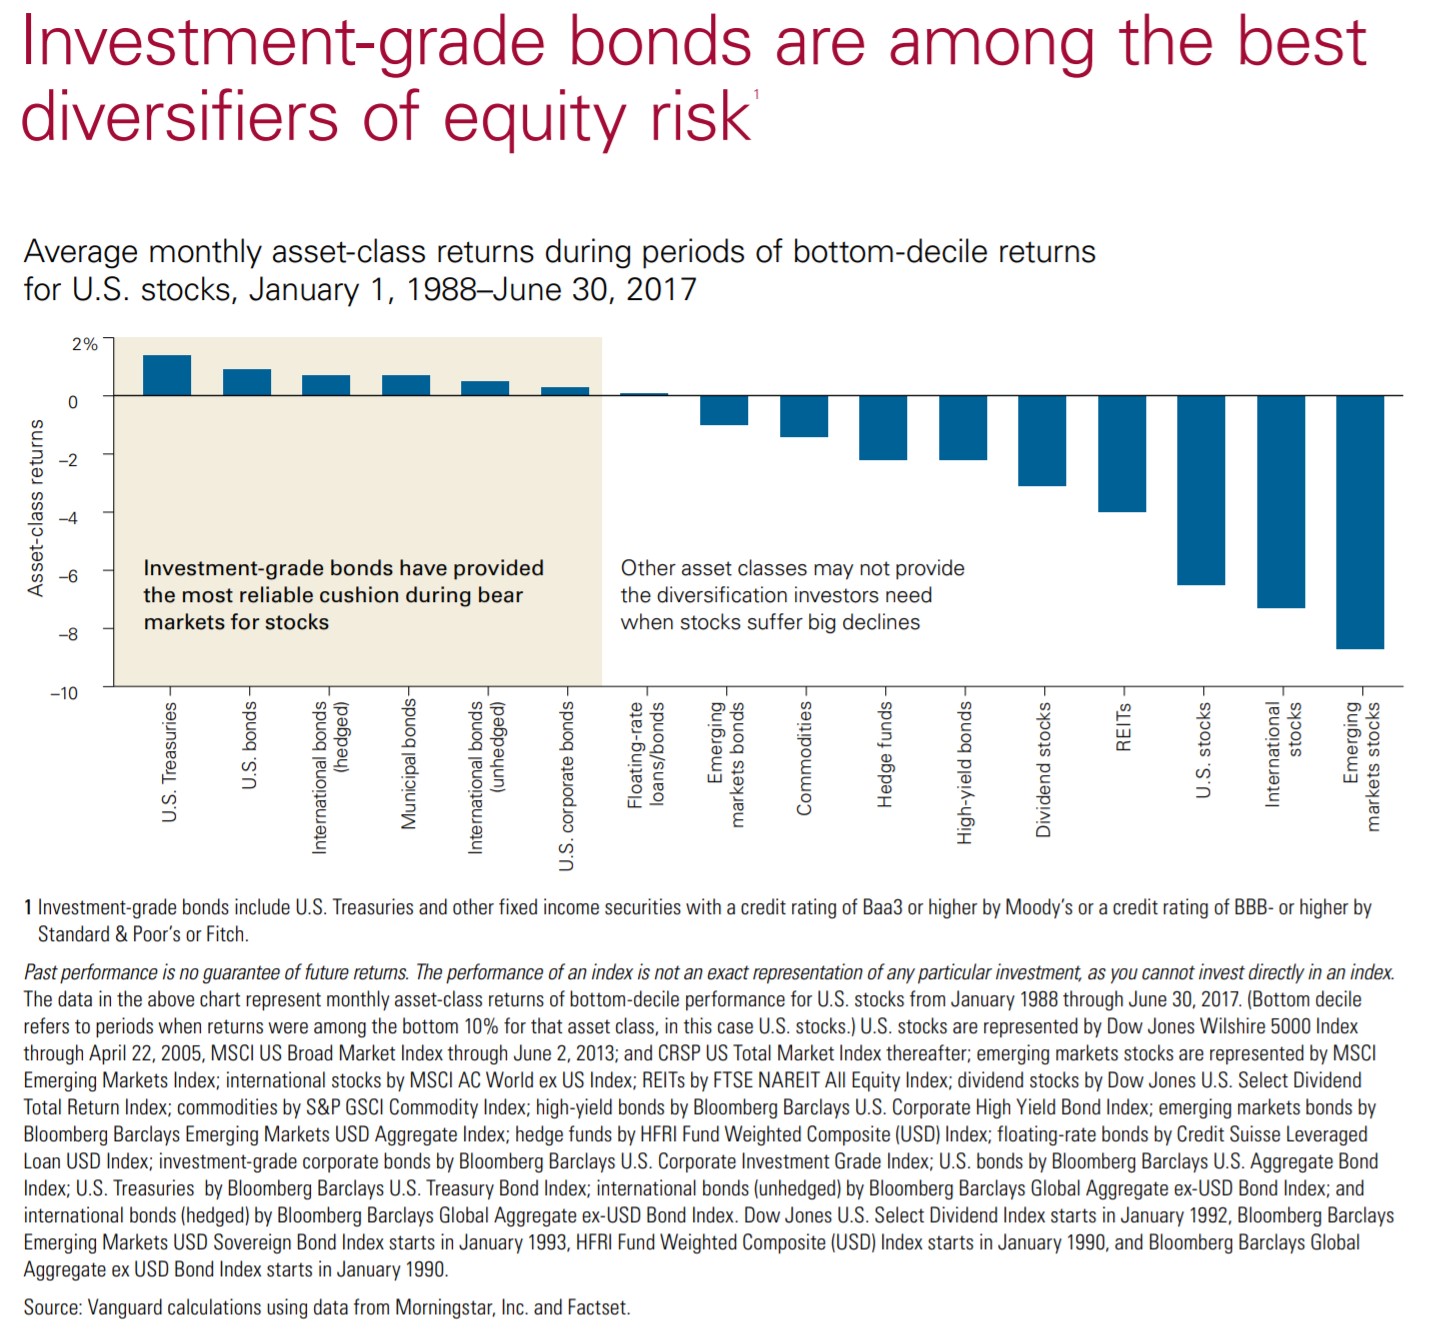
So, despite the short-term price loss in bonds, we believe they still have a role in prudent portfolio. As this Vanguard chart demonstrates, investment grade bonds can absorb the brunt of a bear stock market and keep a portfolio afloat during stressful market times:
So, while opening your 1st quarter statement may be as shocking as falling in Lake Anna in the winter, we believe that the shock will be short lived and ultimately modestly rising rates are not only good for bond investors but are also a good indicator of health in our economy.

(Ben’s shock was short lived too, and he quickly warmed up by the fire!)
