Wondering Whether You Weathered the Weather
I am sure most of you reading this experienced some sort of extreme wind and/or weather conditions this past weekend. All in all, I think Meridian and staff were very fortunate to have avoided any significant damage or long-term outages. Although, my partner Sarah’s kids’ school still doesn’t have power, so she is suffering some psychological damage juggling childcare and work! I know many in the area that were not so fortunate, and lost large trees, were without power for a long period of time, or suffered property damage. For those of you in this category, I hope and pray that you and family stayed safe and are in the process of repair and recovery.
It was an unusual weather event to say the least, and it was particularly hard to prepare for. It’s difficult to think of all of the things around your home that might blow away in high winds. I thought I had done a good job of removing items from our front porch and small back patio, but I did forget about our gutter downspout diverters. They ended up strewn all over the yard, and I am pretty sure we lost one completely. I am happy to report that my family and I were able to make it through this harrowing ordeal! 😊

Unexpected and extreme market swings can also be hard to prepare for. And, much like the weather, they can be almost impossible to accurately predict. For the average investor, attempting to do so has been proven to be counterproductive. See the chart below from JP Morgan (click to enlarge):
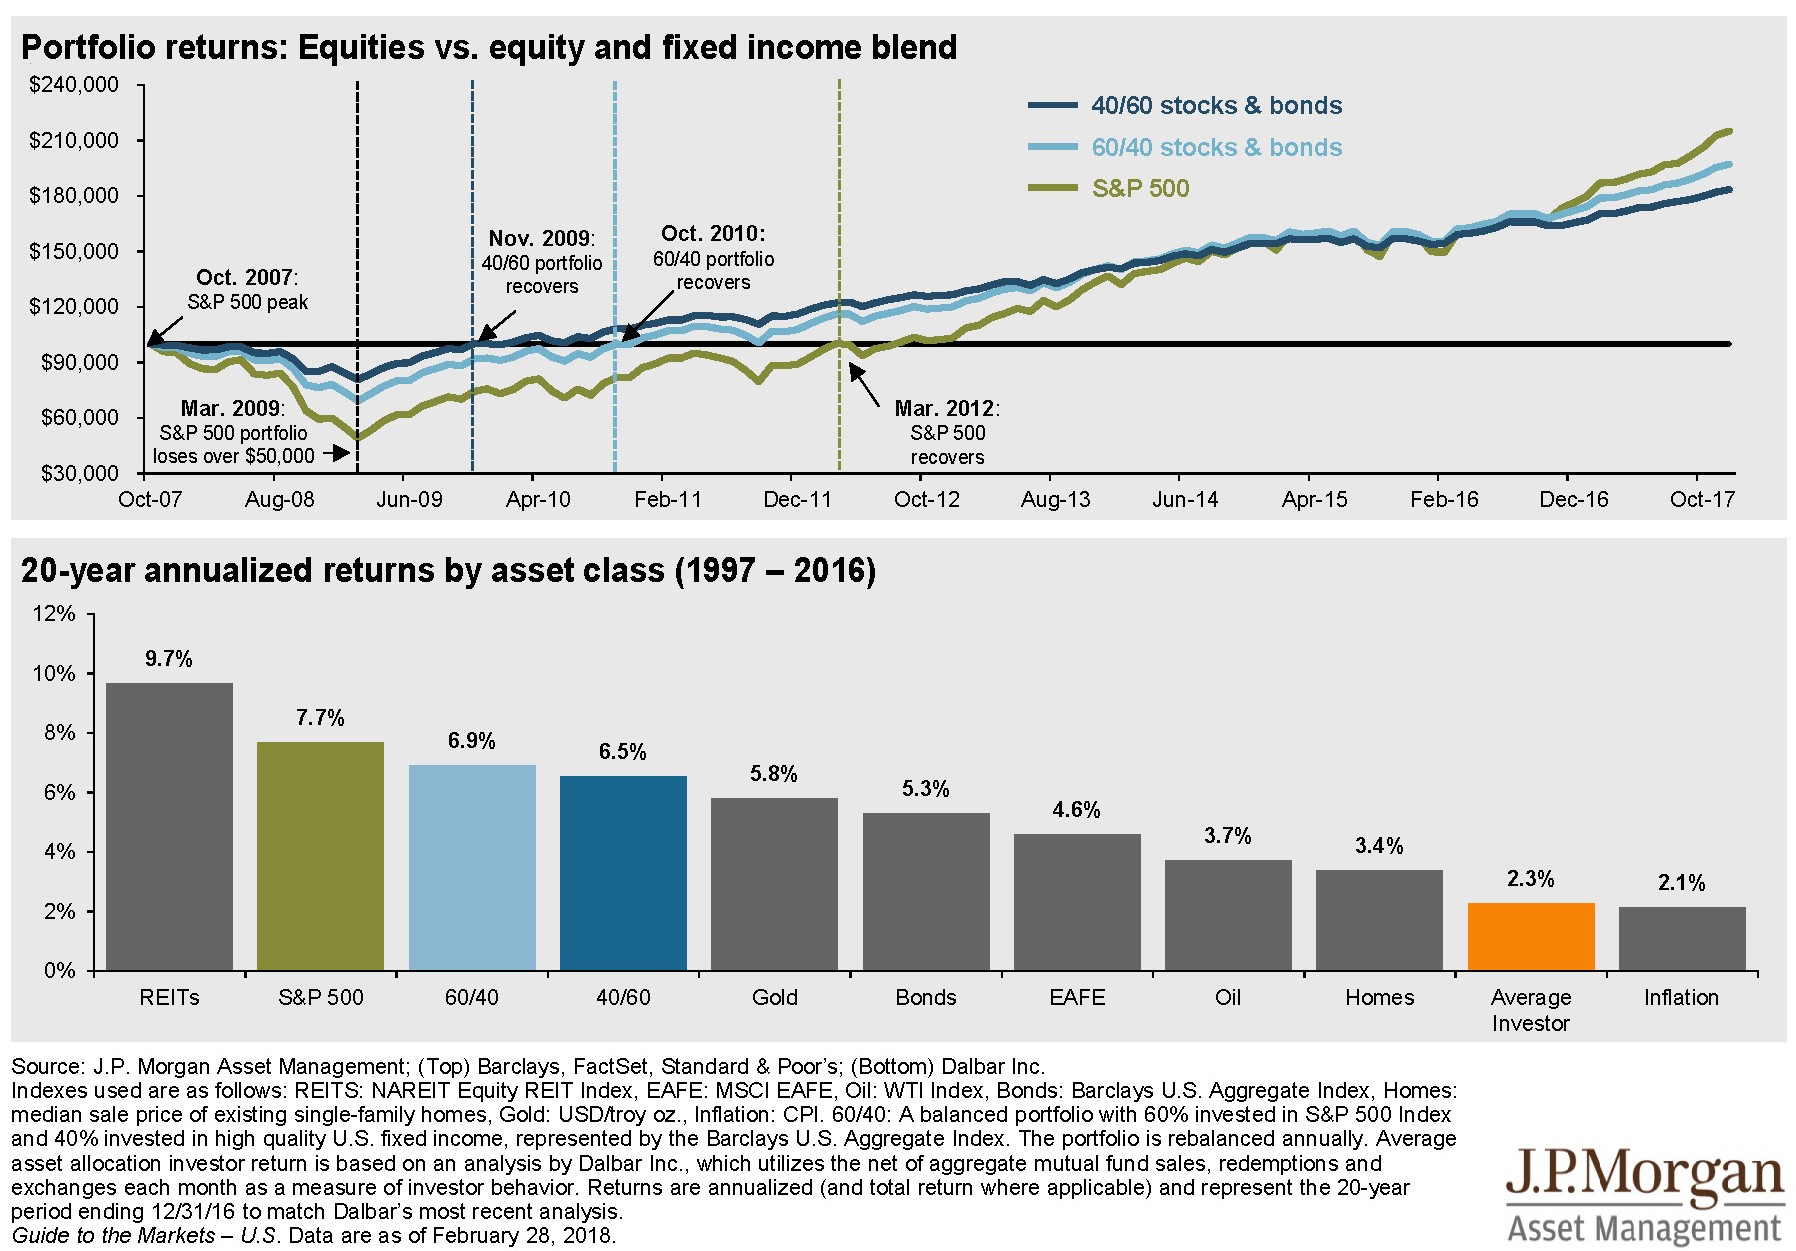
The top of the chart is certainly interesting, as it looks at 3 different types of investments and how they performed from the top of the market in 2007. The more conservative portfolio (40% stocks & 60% bonds – light blue line) recovered more quickly from the 2008 downturn, but the more aggressive investor (100% stocks – green line) was rewarded with higher overall returns.
I think what is most striking is the bottom of the chart that shows the annualized returns of different assets from 1997-2016. The “average investor” barely beat inflation over that timeframe. As noted in the fine print below the chart, “…investor return is based on an analysis by Dalbar, Inc., which utilizes the net of aggregate mutual fund sales, redemptions and exchanges each month as a measure of investor behavior.” In short, people moving their money in and out of the market based on short-term swings. I can’t think of a starker example of how individual investors have hurt themselves.
In extreme conditions, we are all likely to lose something, but good preparation can limit those losses. Here’s hoping that the worst thing we lose in the next big storm is equivalent to a gutter downspout diverter!
Nathan
