Does International Investing Make Sense?
While 2025 has been full of surprises, the double-digit outperformance of international stocks over United States stocks was on very few economists’ bingo cards for this year!
Following another strong year of outperformance in the US economic growth and market returns, non-U.S. equity markets have overtaken US markets and are leading economic growth this year. U.S. equities are down about 3%, while international equities excluding the U.S. are up over 9%.
International stocks have best start to a year in a quarter of a century.

Source: Charles Schwab, Bloomberg data as of 3/7/2025.
International Stocks on the Rise
Indexes are unmanaged, do not incur management fees, costs, and expenses and cannot be invested in directly. For more information on indexes, please see schwab.com/indexdefinitions. Past performance is no guarantee of future results.
There are a few reasons why international stocks are rapidly rising after years of sitting in the US stock market’s shadows:
- Cautious consumers starting to perk up: European consumer confidence has moved up for two months, and with increased confidence, consumers have been beginning to spend more.
- Financial conditions have started to improve: Bank lending to households and corporations has been accelerating. In addition, central banks overseas have started rate cutting cycles to kick start economic growth.
- European economic data beating expectations: Positive economic surprises (where actual economic data has exceeded the assumptions) have accelerated in Europe, while surprises in the US have trended negative (data is coming in weaker than expected).

Source: Charles Schwab, Citigroup, Bloomberg data as of 3/7/2025.
Indexes are unmanaged, do not incur management fees, costs, and expenses and cannot be invested in directly. For more information on indexes, please see schwab.com/indexdefinitions.
Whether this international outperformance will continue depends on further improvement on the economic data and looser monetary policy overseas. However, this quarter’s outperformance highlights the importance not only of being diversified but also underscores the need for adequate global equity exposure!
2025 Market Surprise
While it is tempting to invest only in companies based in the US, half of the global market capitalization of $123.6 trillion is comprised of international businesses:
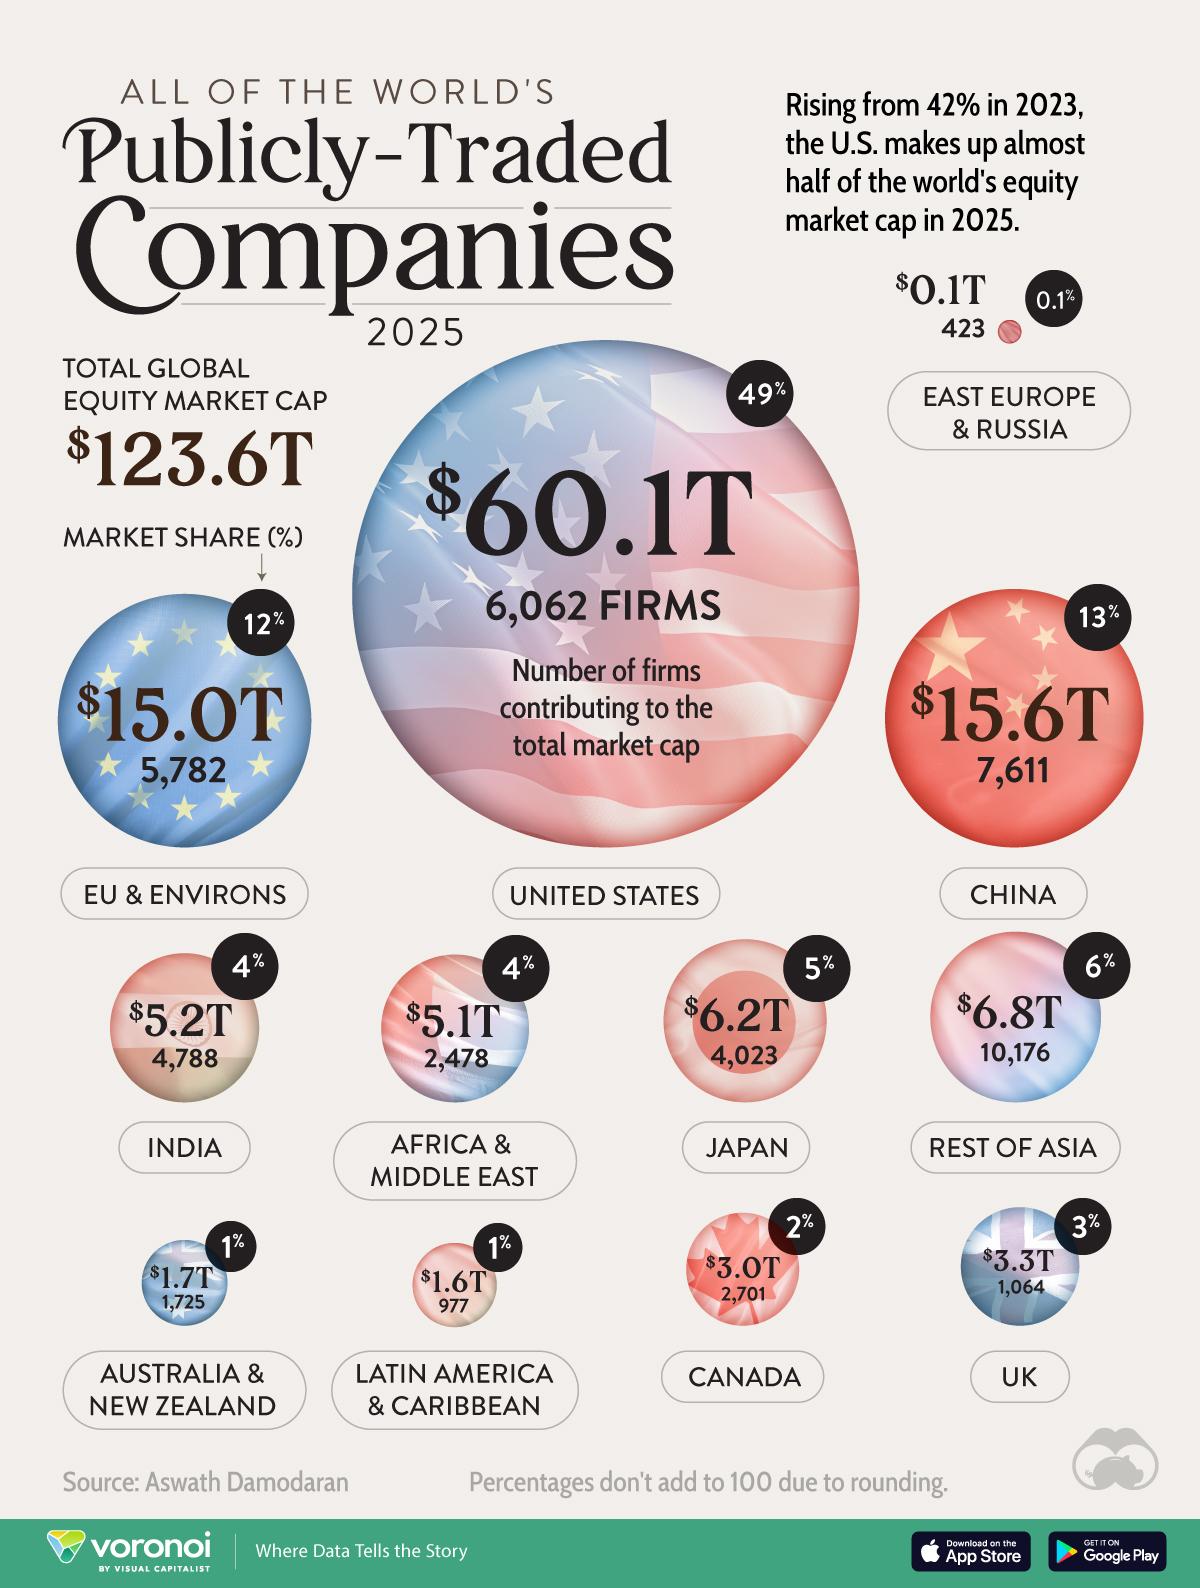
Source: https://www.visualcapitalist.com/124-trillion-global-stock-market-by-region/
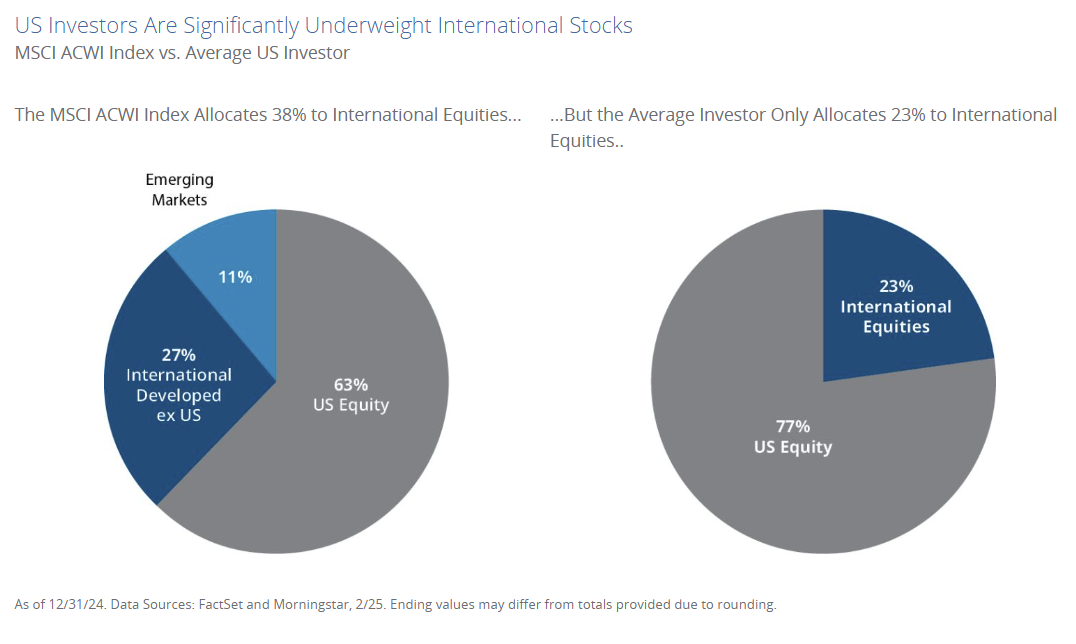
The MSCI All Country World Index (ACWI) is a market index designed to replicate the performance of the global stock market as a whole. That index weights US Equities with 63% allocation. The average American investor has 77% of their portfolio in US Equities based on Morningstar portfolio analytics:
Having exposure to companies overseas can also smooth out portfolio volatility. This year, having international exposure in a portfolio significantly offsets the US market declines. We’ve often added this chart to our quarterly letters or blogs, but this is the “asset return quilt”…
This chart looks at the annual returns for a range of different asset classes across a 15-year time period. It has everything from stocks and bonds to commodities and cash. On the far left side of the chart, you can see both the annualized return and annualized volatility over the last 15 years for each asset class. Cutting through the middle of the chart is a hypothetical diversified portfolio composed of a blend of all asset classes:

Source: Bloomberg, FactSet, MSCI, NAREIT, Russell, Standard & Poor’s, J.P. Morgan Asset Management.
Large cap: S&P 500, Small cap: Russell 2000, EM Equity: MSCI EME, DM Equity: MSCI EAFE, Comdty: Bloomberg Commodity Index, High Yield: Bloomberg Global HY Index, Fixed Income: Bloomberg U.S. Aggregate, REITs: NAREIT Equity REIT Index, Cash: Bloomberg 1-3m Treasury. The “Asset Allocation” portfolio assumes the following weights: 25% in the S&P 500, 10% in the Russell 2000, 15% in the MSCI EAFE, 5% in the MSCI EME, 25% in the Bloomberg U.S. Aggregate, 5% in the Bloomberg 1-3m Treasury, 5% in the Bloomberg Global High Yield Index, 5% in the Bloomberg Commodity Index and 5% in the NAREIT Equity REIT Index. Balanced portfolio assumes annual rebalancing. Annualized (Ann.) return and volatility (Vol.) represents period from 12/31/2009 to 12/31/2024. Please see disclosure page at end for index definitions. All data represents total return for stated period. The “Asset Allocation” portfolio is for illustrative purposes only. Past performance is not indicative of future returns.
Guide to the Markets – U.S. Data are as of February 28, 2025.
The Power of Diversification
Adding developed and emerging market stocks, as well as small US companies and bonds, helps to dampen volatility and smooth out the annual returns. The gray square running through the middle is the diversified portfolio—that portfolio is never the worst returning portfolio for the year—it diversifies away the risk of being the absolute loser at the bottom.
The more interesting part of the chart is the far left bars—the most left is the 15 year annual average return—the diversified portfolio averages 7% annual returns since 2010—the 4th best annual performer. But the next column is the critical piece—it delivers those returns with much less annual risk—the 4th least volatile portfolio. Sort of the holy grail of investing—more return with less risk!
While we wish that the US markets would settle a bit, we are glad to see diversification working in real time in 2025—and finally, the allocation to global stocks reward the patient investors who’ve included them in their portfolios for a while!

Yakel family enjoying the global economy abroad in Italy last year.
