Snow Day
We hope everyone is enjoying the snow—our kids are all delighted to have their first real snow of the season. Those who are shoveling (me and my husband) are not enjoying it as much.

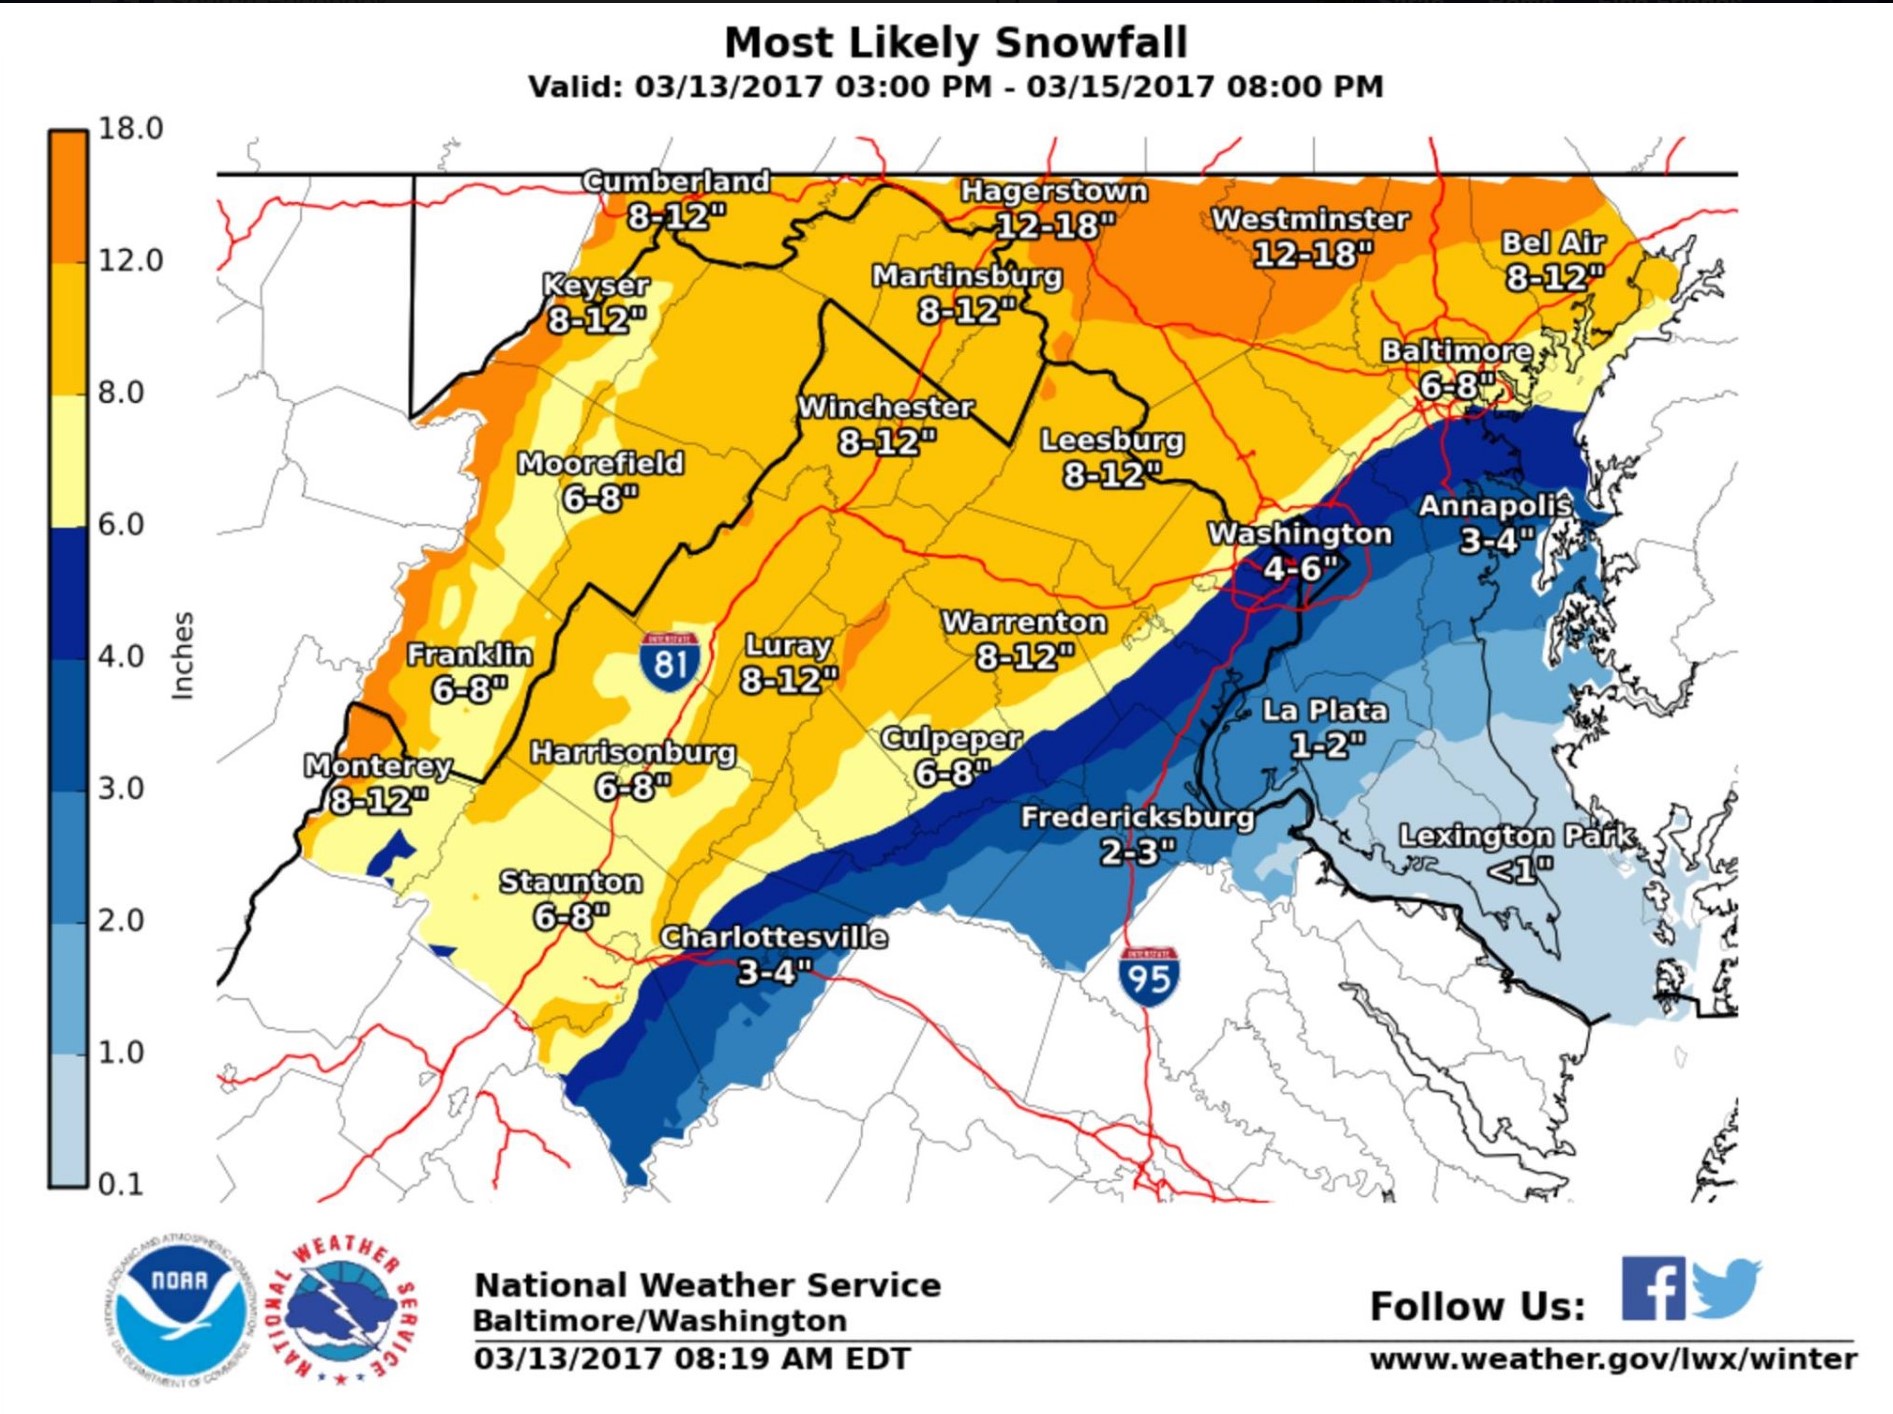
As with every winter storm, it has been funny to hear the hysteria in the forecasts—originally, the National Weather Service had published this map showing our area getting 8-12” of snow. We quickly heard rumors of 12-15” and all travel being halted for days on end. Shelves in the grocery store were quickly emptied of milk, eggs, and bread.
As we got closer to the storm, the models all begin to disagree as to timing, temperatures, and total snowfall. Here is a summary of all of the model runs, courtesy of NOVA Weather Junkie—basically, the models predicted between 0-18” of snow for Dulles. Pretty wide range for 24 hour forecast!!
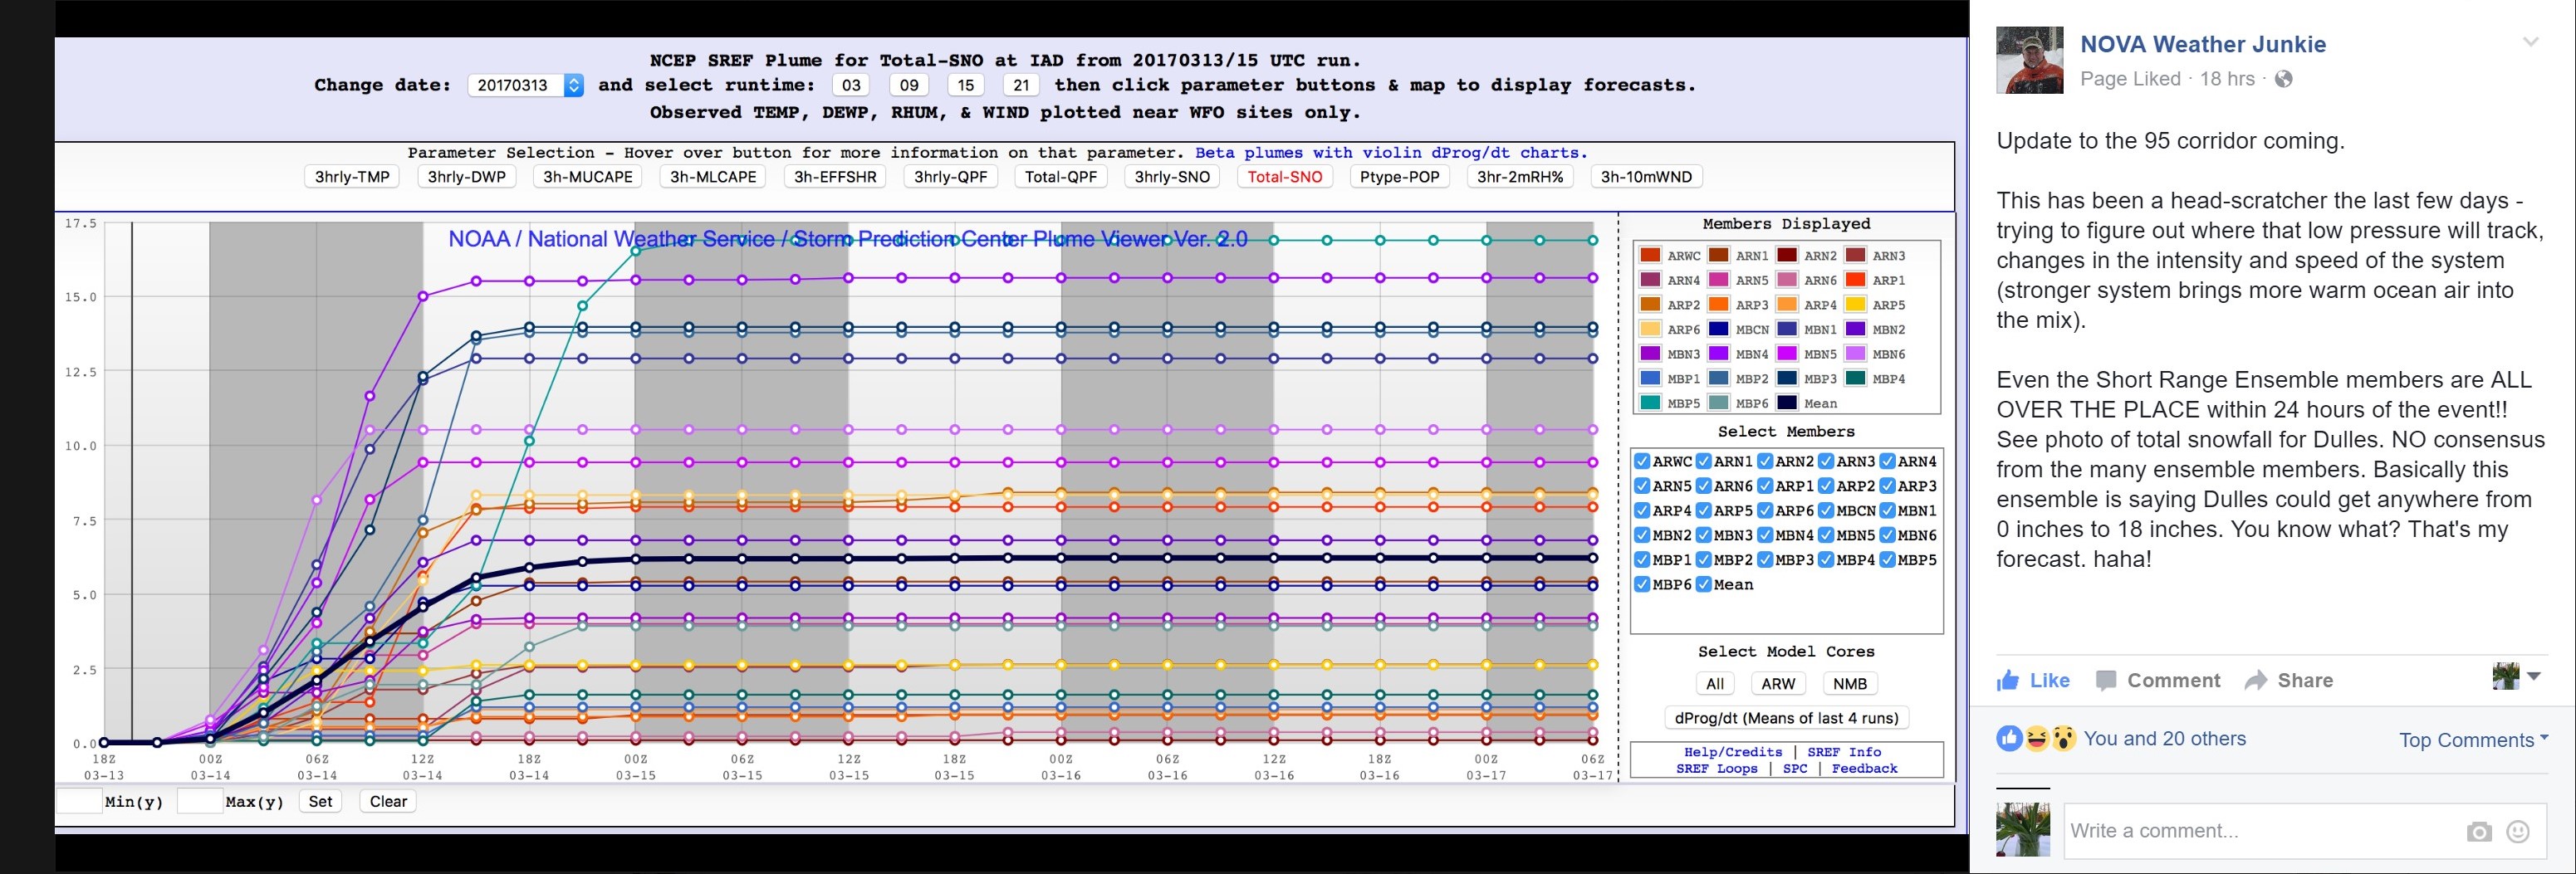
Click on the image to enlarge.
In the end, we probably got about 4-5 inches of wet snow. Definitely within the 0-18” forecast…
Forecasting the weather is very similar to trying to predict the movements of the stock market on a day to day basis—there are just too many variables to accurately get a sense of which direction the market will move or how quickly it will move. Short term market forecasts are less useful than the short term weather forecasts.
But, over longer periods of time, patterns emerge. Just as we know that in Virginia, it will generally be miserably hot and humid in August, and most likely it will 40 degrees and rainy at Christmas, we believe a few kinds of stocks generally return greater reward for assuming the risk of owning them over long periods of time.
Nobel prize winning research by Eugene Fama and Ken French identified characteristics of stocks that tend to deliver excess return, the main factors being:
- Stocks tend to outperform bonds over long periods of time
- Small companies tend to outperform large companies over long periods of time
- Value companies tend to outperform growth companies over long periods of time
- High profitability companies tend to outperform less profitable companies over long periods of time
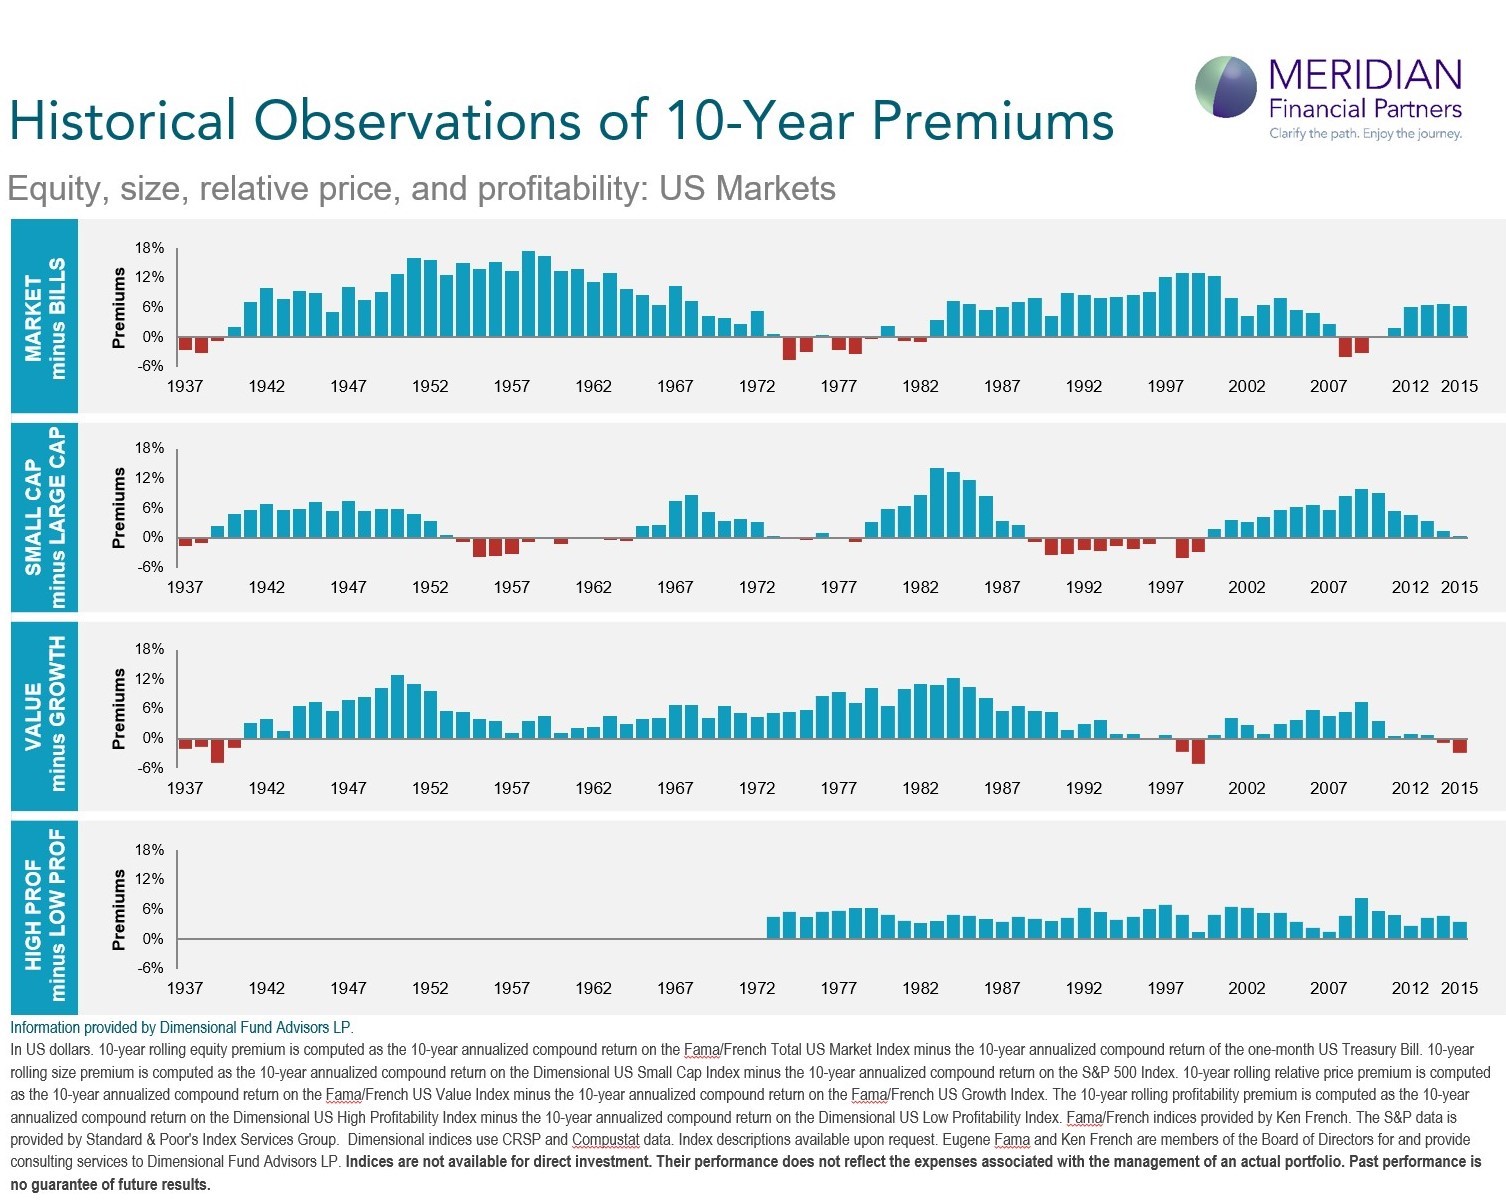
Interestingly, these factors do not deliver outsize returns over short time periods. In this chart from Dimensional Funds, each factor’s annual excess performance is shown, and you will see many years where the factors underperform the general market:

However, when you look at the factor excess performance over a ten year period, it is much more consistent:
When we use this knowledge of long term patterns to carefully construct portfolios, we hope to be able to capture some of this potential return!
