Comparing Apples to Oranges
Lately, some of our clients have been asking us why their account is not performing as well as the S&P 500 so far this year. It’s certainly a valid question, but it misses the point of what it means to stay diversified. Certainly, investing SOME of your money in a low-cost index fund is a good idea, but putting all of your money into one type of asset can be a bad idea over the long term.
If you agree with the premise that having your “eggs” all in one basket is a bad idea, then that’s essentially what you’d be doing by investing solely in one index. As you may already be aware, the S&P 500 represents 500 large US companies listed on the US stock exchanges. Only investing in one country’s market can lead to higher risk and lower returns over the long term.
Side note here: I should just insert “over the long term” after almost every market related comment! In our world, we generally take ‘long-term’ to be 8-10 years or more. As your timeframe gets shorter, more conservative and less volatile investments should be introduced. Unfortunately for all of us, less volatile usually equals lower return over time.
The outperformance of the S&P 500 over other asset classes is likely short-lived and history tells us the same. It is virtually impossible to predict which area of the market will be the best performer in any given year. See the chart below:

If you are a diversified investor, you should be comparing your returns to a comparable blended index. Comparing your diversified portfolio to the S&P is akin to comparing apples to oranges (I’m using lots of clichés here!). For example, if you own 40% US stocks, 20% International stocks, and 40% in bonds, you should be looking at comparable indexes in each of these categories.
Comparing your US holdings to the S&P 500 might be okay, but even in that portion, you should be holding different sizes of US companies. As mentioned, the S&P only measures the large US companies. As you can see from the above chart, we should have all been invested in mid-sized US companies through the first half of the year. To us the old cliché, hindsight is always 20/20.
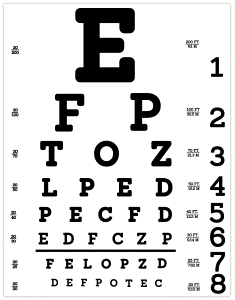
Another aside: In a brief Google search about where this phrase came from, I learned that the chart below is called a Snellen chart and if you can read each row of the chart from 20 feet away, then you have 20/20 vision or “normal acuity.”

Don’t rely on short-term trends and don’t chase returns. The S&P 500 index may well be the best performer of 2019, or it could enter correction territory like it did in late 2018. Stay diversified across many asset classes, and remain appropriately invested for your timeframe.