Bumping Into the Ceiling
I will be honest, I was a little hesitant to address this topic due to its political nature, but given how frequently this topic has been addressed in recent client meetings and the future effects it could potentially have on the markets; it feels important to touch on in this week’s blog. On January 19th the U.S. hit its borrowing limit of $31.381 trillion and immediately began implementing measures to meet its debt obligations, pushing the deadline to early June.

In an effort to bridge the gap over the next few months, sources of funding include – first, utilizing the Treasury General Account ($456 billion) and second, are sources of “extraordinary measure” which include suspending new investments in various retirement plans for government employees. These retirement plans would be made whole again once a resolution is met.
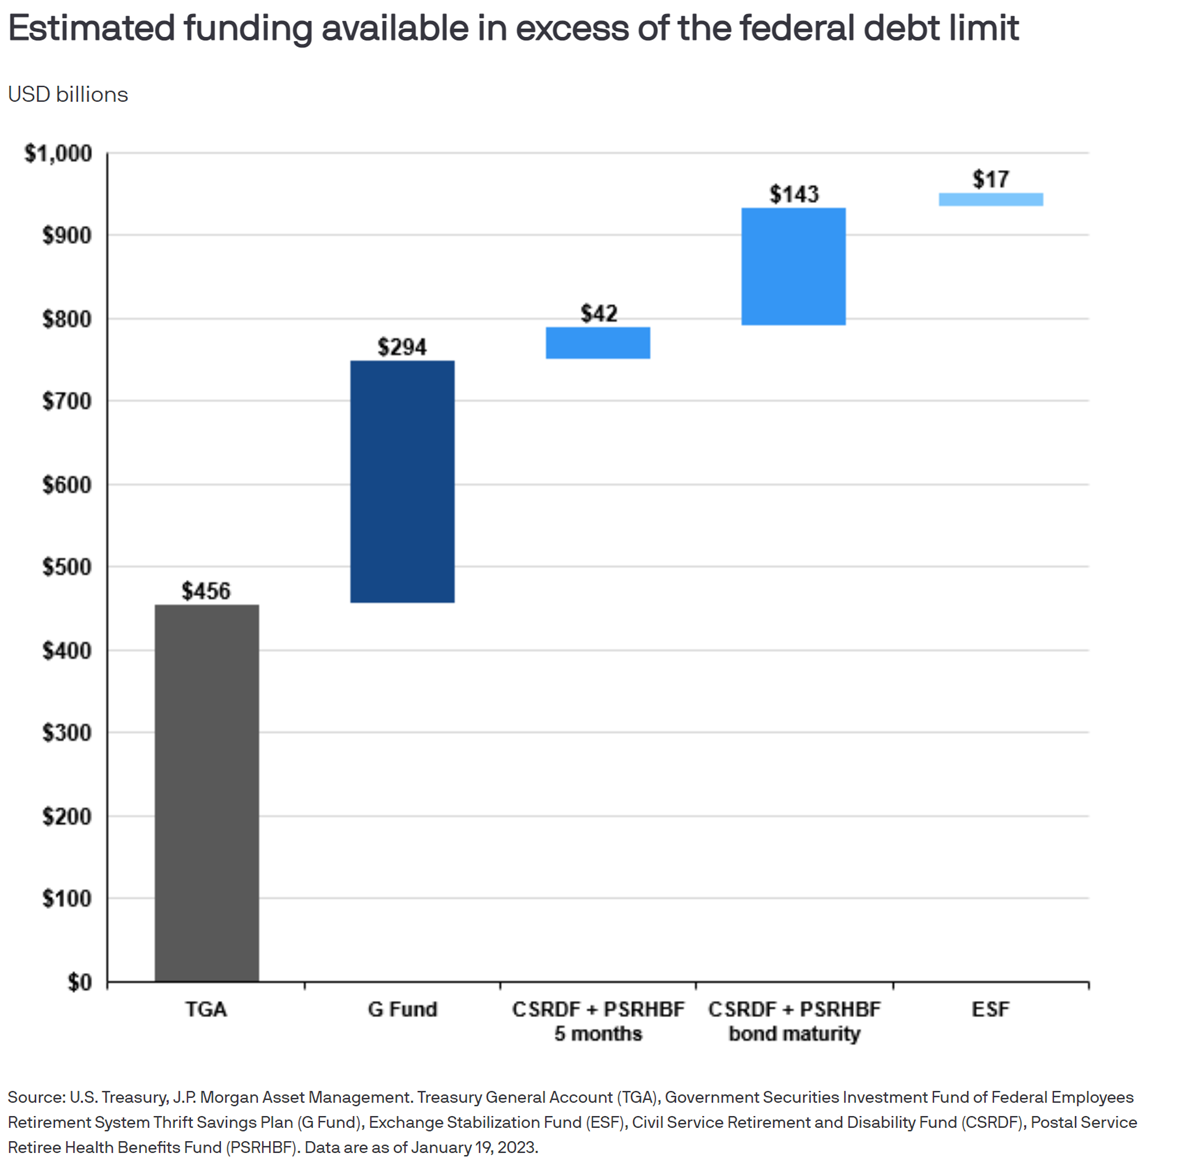
All of these combined sources equate to approximately $950 billion of available funds. The question is if that is enough to meet the government’s obligations until a resolution is met.
Since 1960 Congress has suspended or raised the debt ceiling 79 times….. 79! Not Congresses first rodeo; however Hartford Funds put it eloquently, “ Historically, raising the debt ceiling is a frequent, routine, and bipartisan procedure (without conditions), but as of late, it has evolved into a process with risky political maneuvering and complex economic calculations.”
Current conditions feel a little different than previous debt ceiling debates — financial markets stumbled through 2022 and are trying to find it their footing after one of the worst years since 2008 from an absolute returns perspective, politically the House is divided, and uncertainty remains ahead on global economics and earnings. However, while the grapple with the debt ceiling could create turbulence in the markets, historically both bond and stock markets are resilient.
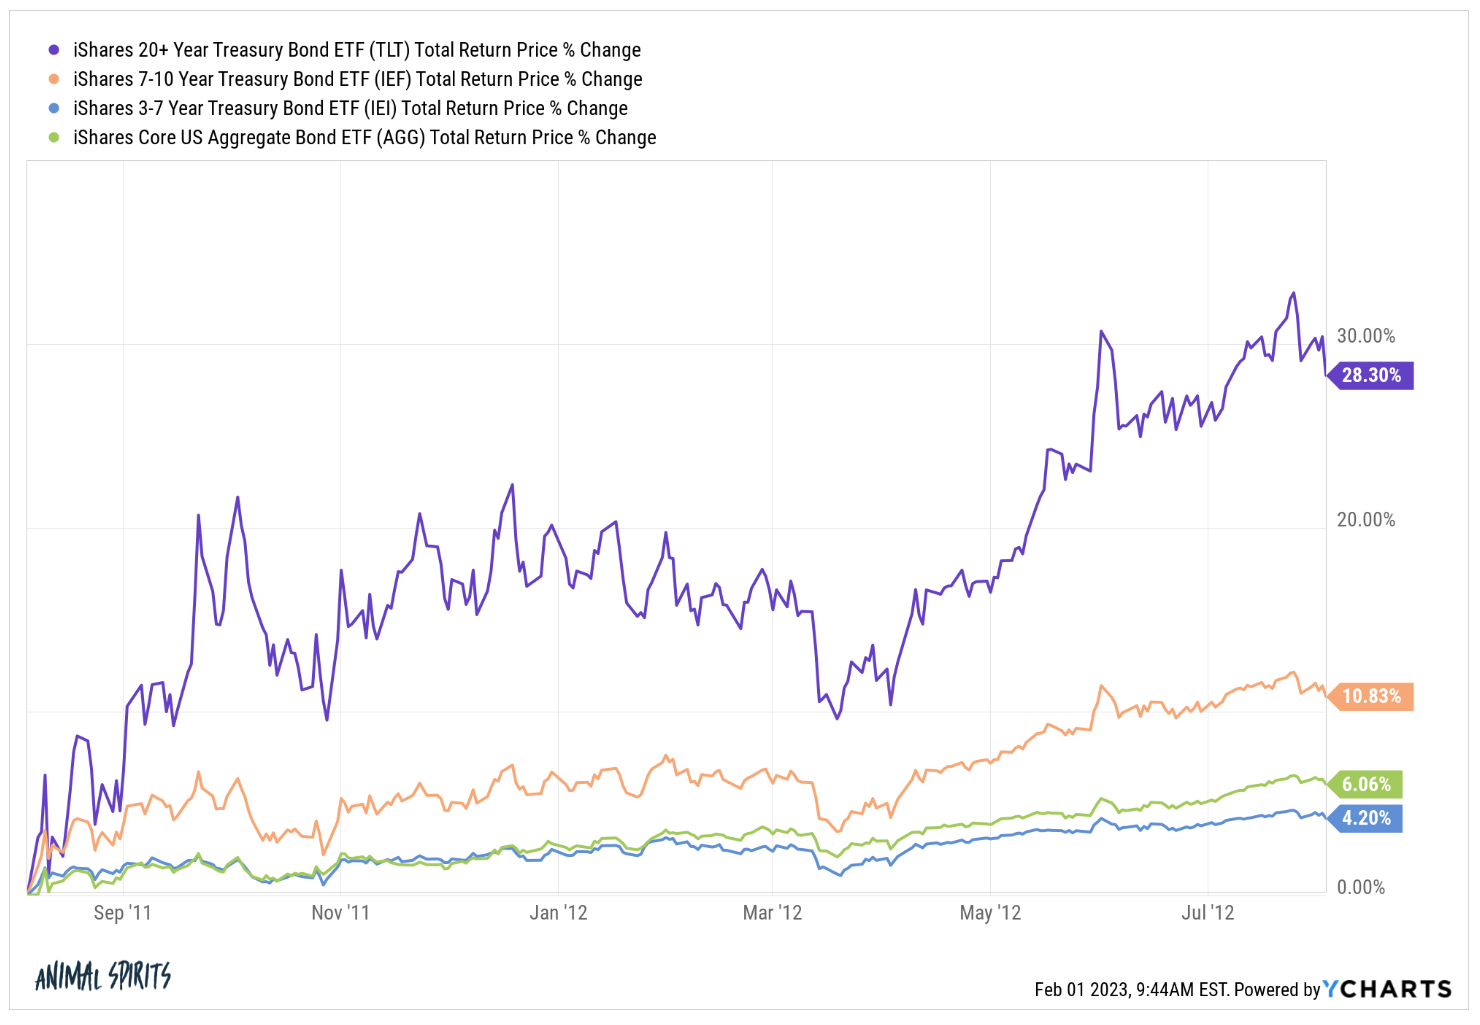
Many of our blog readers may clearly remember the debt ceiling crisis of 2011 which ultimately led to Standard and Poore’s downgrade of the U.S’s credit rating from AAA to AA+. Headlines were pretty scary sounding and the S&P 500 had a few very volatile weeks following the downgrade.
However there was a strong rally in Treasuries and the bond markets.
And the S&P 500’s total return was around 20% in the 12 months following.
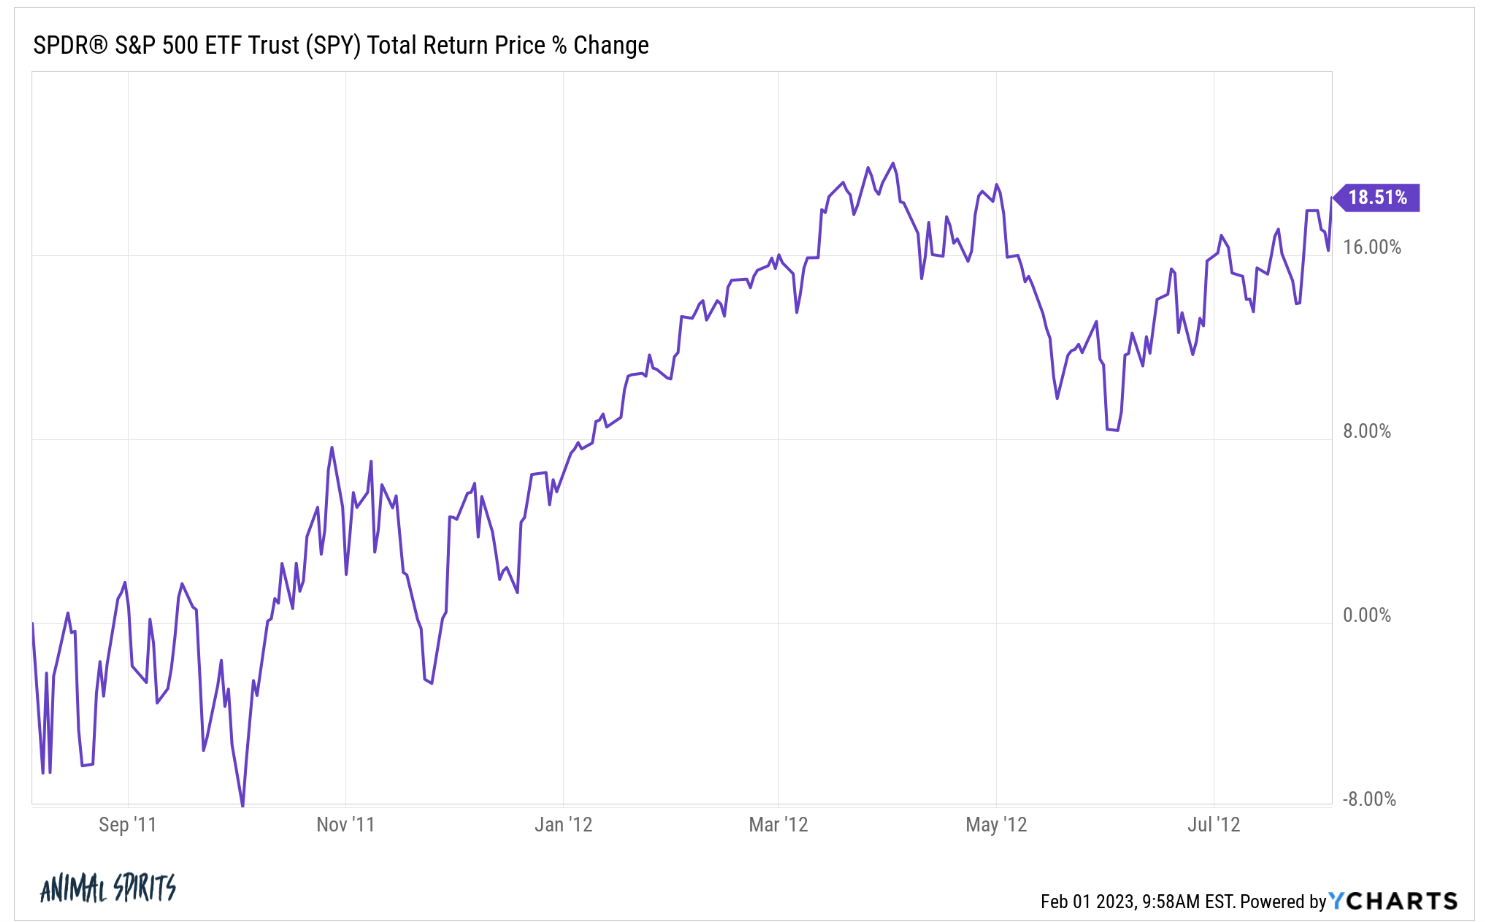
Of course past returns do not guarantee future performance, but we can use history as some guidance that while markets were bumpy while everything unfolded, they rebounded once an agreement was reached. **I think it is worth noting that while most investors look at the S&P 500 as a benchmark, that is not representation of a truly diversified portfolio, which you all know Meridian strongly advises on!
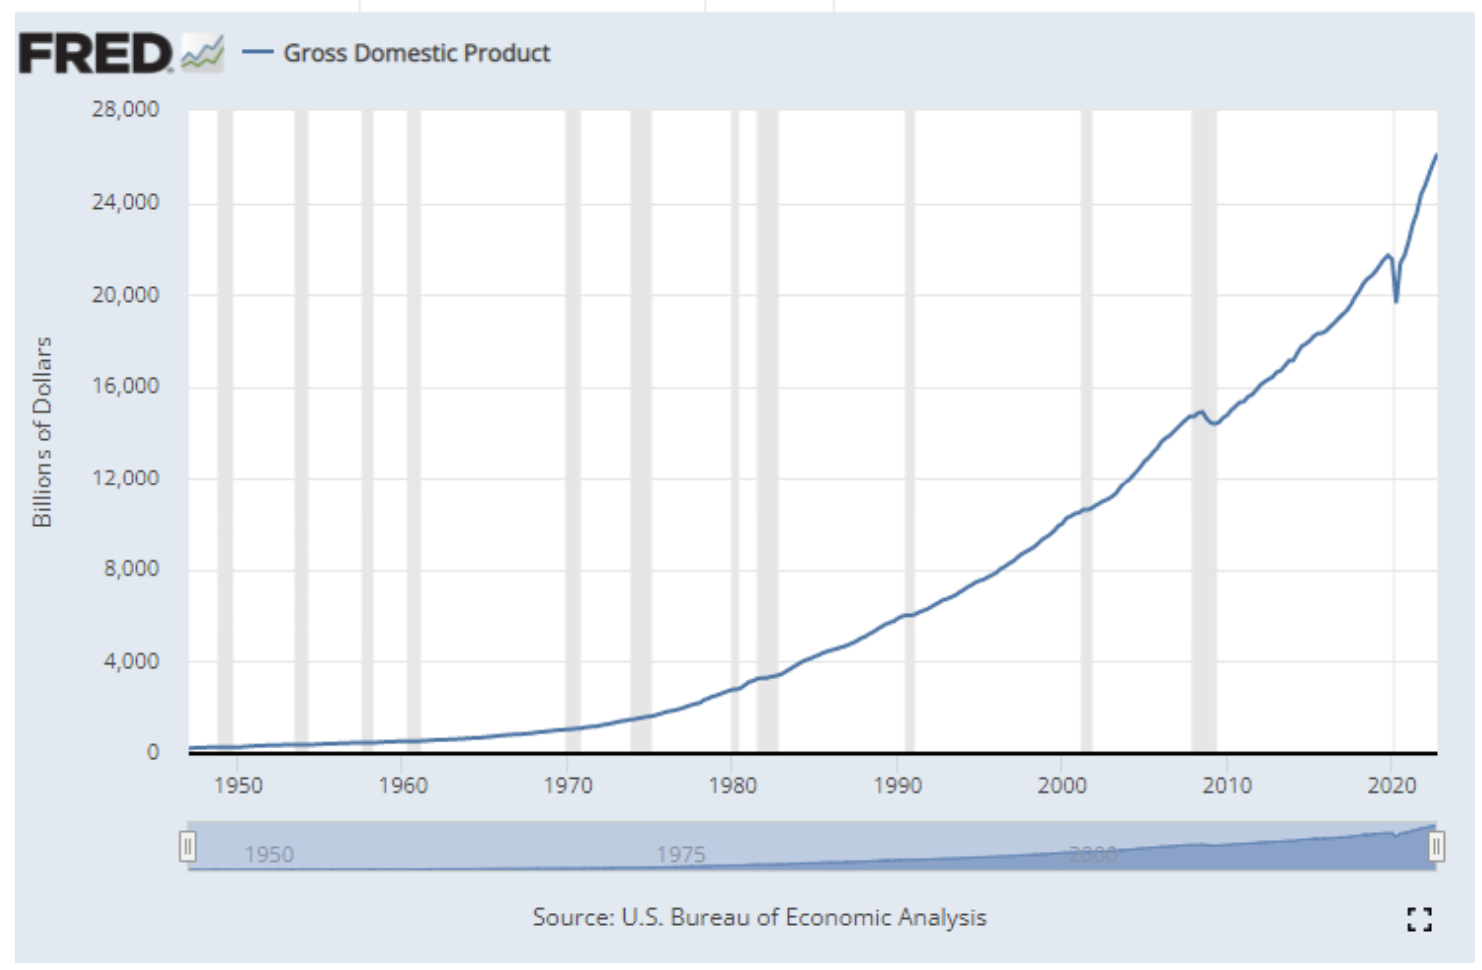
Obviously $31 trillion is a A LOT of debt and for any strong financial plan, a low debt-to-income ratio (or in global economics, debt-to-GDP ratio) is preferable. It debt continues to increase (the numerator) then GDP must also continue to increase (the denominator). Good news is the long-term increase in GDP looks to be on an upward trajectory.
So while the looming debt ceiling resolution is something we continue to monitor (along with we many other factors such as inflation, jobs, and economic data), we encourage our clients to focus on things they and we at Meridian are able to control such as personal debt-to-income ratios and reviewing portfolio allocations to ensure they line up with long-term and short-term goals.
Historically Congress has always come to some sort of agreement in the dozens of times the debt ceiling as been addressed, so only time will tell what and when the agreement will entail. Until that time, don’t hesitate to reach out to your advisor with questions or way to help you stick with the plan!
