Cone of Uncertainty
This week, we are enjoying the last of summer in Sandbridge, Virginia:

For the last several years, we meet my family at the beach the last week of August, before Labor Day. During this “shoulder” week, rental prices drop substantially and the beach is much less crowded now that most Virginia school systems have started the academic year. We love everything about going to the beach at this time—except for one thing—we are on the edge of the Atlantic hurricane season.
Last year, our vacation was cut short by Tropical Storm Hermoine, which came right up the North Carolina coast and carried high winds and torrential rains. We saw the storm brewing on Tuesday and started anxiously following the probable path. It looked like this:
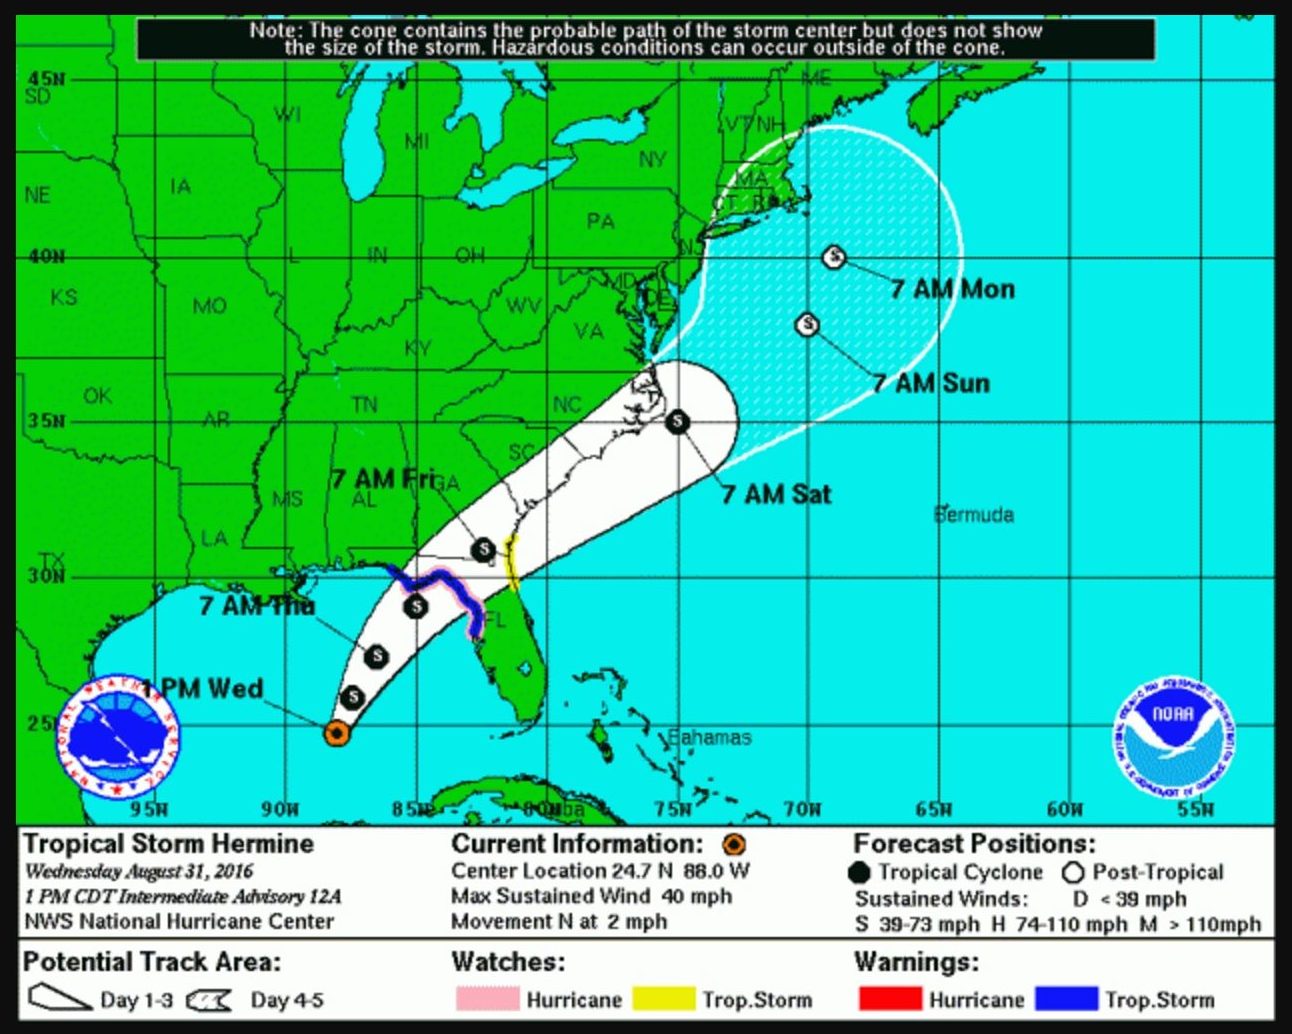
Meteorologists call this map of the potential path of a storm the “Cone of Uncertainty”. Not to be confused with the “cone of shame”:

Forecasting Your Financial Future
The cone of uncertainty illustrates the historical margin of error in storm forecast tracks. In the cone, the margin of error is relatively small 12 hours or 24 hours out, but past that—2 or 3 days later—the margin of error is really wide because of all of the unpredictable variables. Unfortunately, Hermine was on track and ran us out of Sandbridge a day early last year!
In the financial world, we actually see “cones of uncertainty” as well. When we do long range financial planning for big goals like retirement, there are so many variables that we must make reasonable assumptions about in order to project our best thoughts about what the future holds for each client.
So, to model the impact of changes in underlying variables, we use a forecasting tool to project the “cone of uncertainty” about the success of the financial plan. This is a sample:

For this sample client, they are projected to “end retirement” with $1.4 million in portfolio assets (the median number). BUT, if all of the assumptions change for the worse, they could actually run out of money before they die (being short $1.9 million). Conversely, if all of the assumptions change for the better, they could die with a huge surplus ($10 million!). The wide variation of the maximum and minimum outcomes reflects the wide possibility of variables—interest rates, inflation, market returns, etc. As we get further and further from the current day, the range of outcomes gets wider and wider.
Making Sense of Market Noise
We also see reverse cones of uncertainty in stock market returns. Generally, it is difficult to predict stock market movement from day to day or from month to month. There are so many variables that create “noise” in the short term movements of the market.
However, over long periods of time, those short term variables are minimized, and longer term trends appear. This chart demonstrates S&P 500 returns over rolling periods of 10 years:
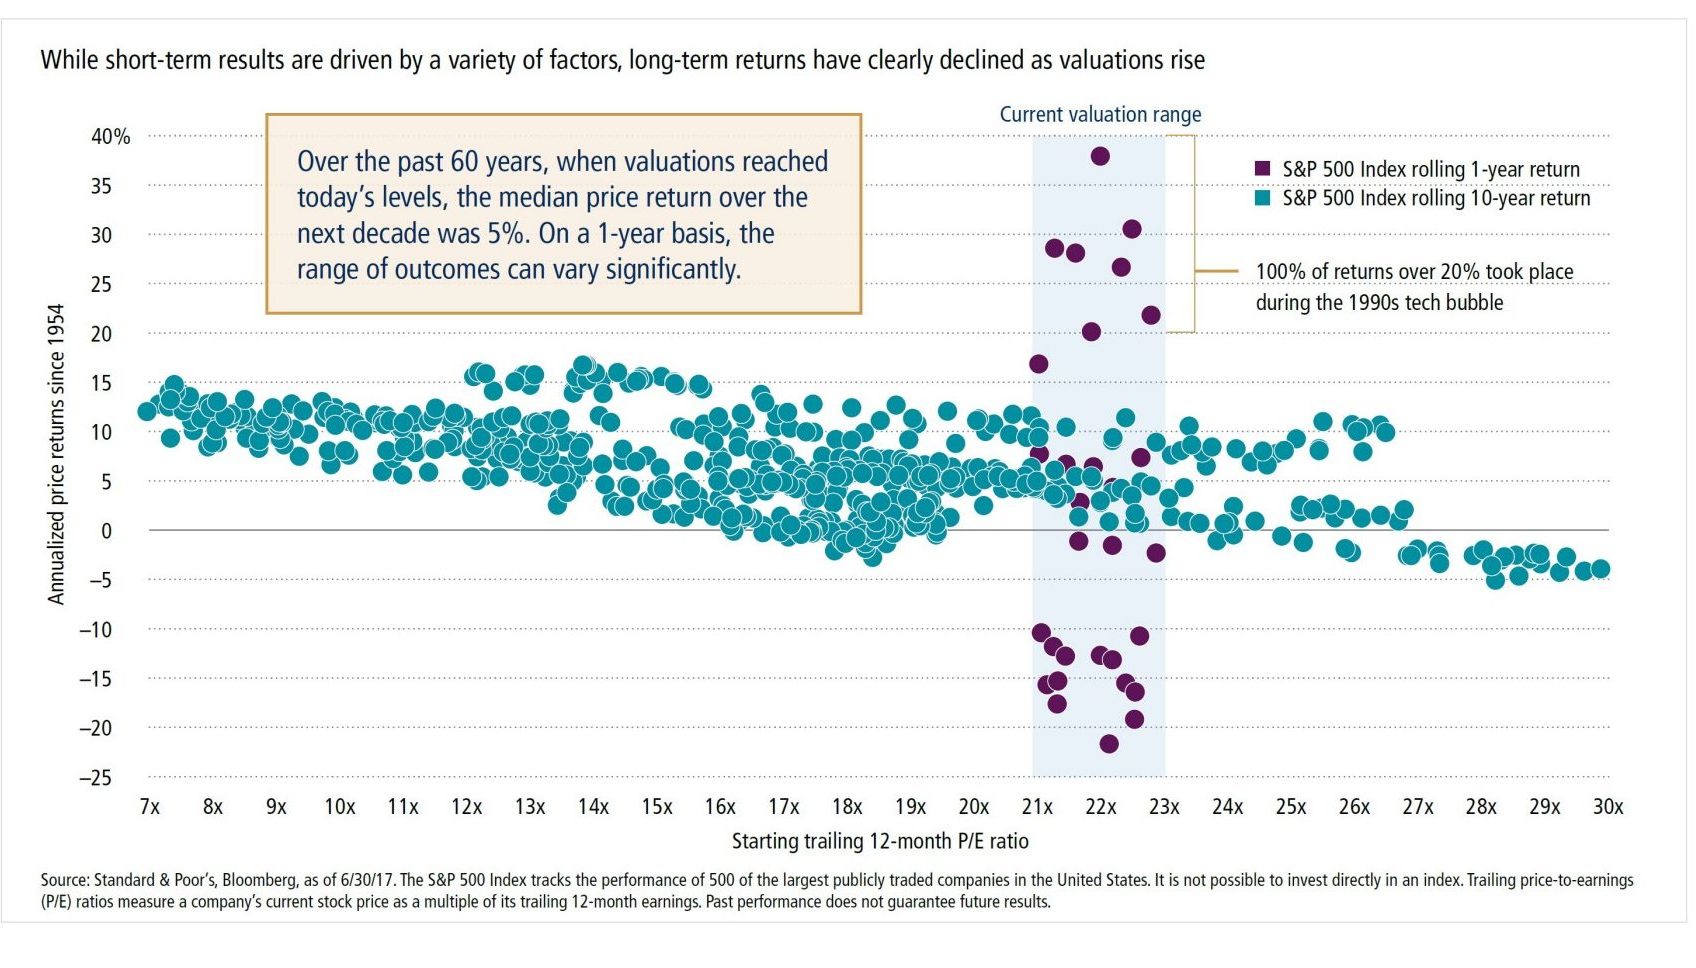
Historically, the more expensive stocks are at the start of a ten year period, the lower the median annual return is for that time frame. Given today’s current valuations, the projected average annual return over the next decade historically has been near 5%.
Interestingly, the purple dots on the chart are the one year returns (not the average return over the decade), and so you can see the very wide dispersion of outcomes in the short term!
As Ben Franklin wrote—nothing in life is certain, except death and taxes. Uncertainty fills our life, but knowing what we can control and making good choices about those things is the key. If Meridian can help you figure out either, give us a call!
