What the Heck is a Melt Up?
The new normal in our industry is media outlets and analysts alike coming up with the latest and greatest “term” that we should all be focusing on and worrying about. Lately, I have seen the term “melt up” used quite a bit, and it is somewhat obviously an oxymoron. I might argue that whoever came up with the term is kind of a moron, but since there is currently such sensitivity around the use of that word, I will steer clear!
Certainly, there is no such thing as melting up, but since the meltdown that has long been predicted by some has yet to happen, a new term is needed. The theory behind the term is that the market is growing irrationally and going up before its inevitable decline. As I mentioned in a previous post, a stopped clock is right twice a day, and at some point the markets will go down (news flash!). Then, those that have long been saying that there will be a “meltdown”, will finally be able to say, “I told you so!”
Market Reality Check
The reality is that the US markets have gone up for longer than almost any time in history. However, lest we forget, this current bull market was preceded by one of the worst markets in history. So, markets and investors were in need of a prolonged recovery. So, where do we go from here?
Most would agree that US markets are slightly overvalued, but unlike some previous lead-ups (or melt ups!), there are some very solid earnings data to support current values. As I write this, we are entering an important earnings season for many companies. We have already heard good news from companies like Goldman Sachs and Morgan Stanley, and most are predicting continued good earnings data. So, the answer to ‘where do we go from here?’ just might be up even more. However, it may not be up as much as the S&P average of about 10% per year.
In an article titled “The Uncommon Average” from Dimensional Fund Advisors, the following question is asked:
“The US stock market has delivered an average annual return of around 10% since 1926. But short-term results may vary, and in any given period stock returns can be positive, negative, or flat. When setting expectations, it’s helpful to see the range of outcomes experienced by investors historically. For example, how often have the stock market’s annual returns actually aligned with its long-term average?”
S&P 500 Index Annual Returns
1926–2016
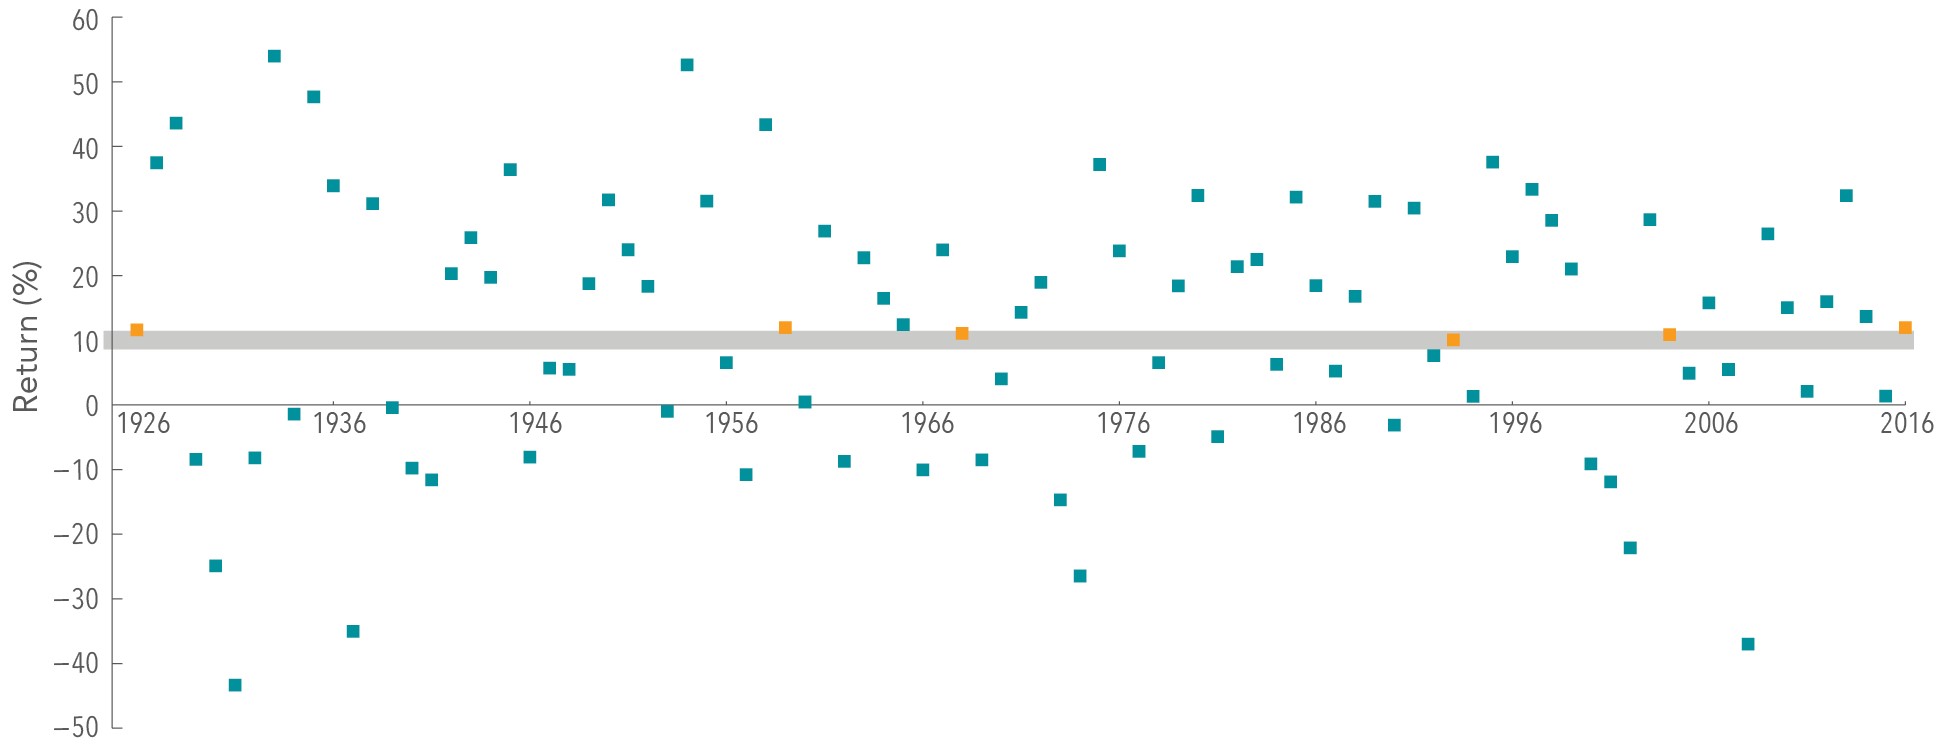
In US dollars. The S&P data are provided by Standard & Poor’s Index Services Group. Indices are not available for direct investment; therefore, their performance does not reflect the expenses associated with the management of an actual portfolio. Past performance is not a guarantee of future results. Index returns do not reflect the cost associated with an actual investment.
The answer: About 6 times in 91 calendar years. In other words, your account will rarely return what the average market returns have provided.
Since we are fresh off of taking Meridian family photos, it reminds me of another question: How many adults and children out of 16 can all look at the camera and smile at the same time? The answer? ZERO! Thanks to Jen Dowell Photography for some great pictures and possibly even better Photoshop skills, it looks like the answer is 16!

Nathan Gilbert
